Data Pipeline Automation: A Practitioner's Playbook
Discover how data pipeline automation streamlines data movement, enhances efficiency, and empowers your team to focus on innovation.

Data pipeline automation is the software-driven orchestration of ingestion, transformation, and delivery so that trusted data reaches consumers with minimal human intervention. The operational payoff is direct: faster time-to-insight, fewer 2 AM pages, and an engineering team that spends cycles on new capability rather than babysitting cron jobs. Three constructs sit at the center of any serious implementation — DAGs for dependency-aware scheduling, Change Data Capture (CDC) for low-latency source tracking, and data lineage for tracing every transformation from raw source to final consumer.
Key Takeaways
Automated data pipelines succeed when every component — ingestion, transformation, orchestration, quality, and lineage — is treated as code, tested in CI, and monitored with the same rigor as production application services.
| Point | Details |
|---|---|
| Automation scope | Covers ingestion, transformation, delivery, orchestration, testing, and governance — not just scheduling. |
| Pattern selection | Choose batch, micro-batch, streaming, or event-driven based on latency requirements and source capabilities before picking tools. |
| Idempotency and contracts | Design every pipeline stage for idempotent writes and enforce data contracts at ingestion to catch drift before downstream impact. |
| Observability from day one | Wire alerting, lineage, and quality checks into the pipeline definition during the pilot, not after go-live. |
| Agent-swarm augmentation | Agent-swarm adds multi-agent orchestration, automated remediation, and custom connector generation for teams managing complex, cross-system pipelines. |
Table of Contents
- What data pipeline automation actually covers
- Core technical components of an automated data pipeline
- Why automate data pipelines — measurable benefits and KPIs
- What pipeline types and trigger patterns should you use?
- Which tooling categories do you need for automated pipelines?
- How to automate data pipelines: an implementation checklist
- Operational best practices and anti-patterns for production pipelines
- How agent-based orchestration augments pipeline automation
- How should you handle errors and recovery in automated pipelines?
- Common data pipeline automation patterns in industry
- What to consider when integrating legacy systems and cloud services
- The 30–90 day operational perspective
- Agent-swarm handles the orchestration layer you don't want to build yourself
- Sources
- FAQ
What data pipeline automation actually covers
Data pipeline automation is the practice of replacing manual, script-by-script data movement with software-managed workflows that handle ingestion, transformation, delivery, orchestration, testing, and governance without requiring an engineer to trigger each step. A pipeline moves data from sources to centralized storage and may implement ETL, ELT, or streaming patterns depending on latency and volume requirements.
Automation applies across the full lifecycle: connectors pull from source systems on a schedule or event trigger, staging layers buffer raw data, transformation logic runs in a defined order with dependency tracking, and delivery pushes clean data to warehouses, lakes, or APIs. Governance and quality checks are embedded in the flow rather than bolted on afterward.
Two misconceptions come up repeatedly. First, automation does not mean zero human involvement — it means human effort is reserved for design, exception handling, and iteration rather than manual execution. Second, ETL and data pipeline automation are not synonyms: ETL is one processing pattern; automation is the operational layer that runs ETL (and ELT, and streaming) reliably at scale.
Core technical components of an automated data pipeline
Modern automated pipelines are composed of discrete, testable layers. Each one carries a distinct responsibility and a primary failure mode engineers need to plan for.
- Ingestion / connectors / CDC. Pulls data from source systems via batch extracts, API polling, or Change Data Capture. Primary concern: source schema changes that silently corrupt downstream records.
- Staging / raw storage. Lands raw data in an immutable zone (object storage, a raw schema in the warehouse) before any transformation. Primary concern: ensuring idempotent writes so replays don't duplicate records.
- Transformation (ETL/ELT). Applies business logic, joins, aggregations, and type coercions. Primary concern: version-controlling transformation definitions as code so changes are auditable and reversible.
- Orchestration. Coordinates execution order, dependency resolution, retries, and SLA enforcement. Tools like Apache Airflow model this as DAGs where each node is a task and edges encode dependencies.
- Monitoring / observability. Tracks system metrics (latency, throughput, error rates) and data metrics (row counts, null rates, freshness). Primary concern: distinguishing infrastructure noise from logic bugs.
- Metadata and lineage. Records what transformed what, when, and with which version of the logic. Primary concern: without lineage, root-cause analysis after a bad data incident becomes archaeology.
- Data quality. Automated assertions (row count checks, referential integrity, statistical profiling) that run inside the pipeline before data reaches consumers. Primary concern: catching drift before dashboards or ML models ingest it.
- Governance. Access controls, masking, retention policies, and audit logs applied programmatically. Primary concern: ensuring policies travel with the data rather than being enforced only at the query layer.
Treat data contracts and lineage as first-class automation inputs, not documentation afterthoughts. A contract defines the schema, semantics, and SLA a producer commits to; lineage records whether that contract was honored at every step. Together they make automated remediation possible — the system knows what was expected, what arrived, and where the divergence occurred.
Why automate data pipelines — measurable benefits and KPIs
The core engineering case is reliability and repeatability. A manually triggered pipeline fails silently when an engineer is on vacation; an automated one retries, alerts, and logs. Beyond reliability, the business case comes down to three outcomes: faster time-to-insight, lower mean time to recovery (MTTR), and reduced maintenance cost as data volume grows.
Global data creation is growing rapidly, and the volume produced each year continues to accelerate. Manual pipelines don't scale with that curve — the engineering headcount required to babysit them grows linearly while automated systems absorb additional sources and volume with configuration changes, not headcount.
| KPI | Why it matters | How to measure |
|---|---|---|
| Pipeline success rate | Tracks reliability of automated runs | Failed runs / total scheduled runs per period |
| Data freshness lag | Measures time from source event to consumer availability | Timestamp delta: source write time vs. warehouse availability |
| MTTR on pipeline incidents | Captures how quickly automated recovery or alerting resolves failures | Time from first alert to pipeline green |
| Schema drift incidents per month | Indicates how often unplanned source changes break downstream | Count of quality-check failures caused by schema changes |
| Engineering hours on pipeline maintenance | Measures operational toil reduction over time | Hours logged against pipeline support tickets |
What pipeline types and trigger patterns should you use?
Pipeline architecture decisions start with latency requirements and cost tolerance. The four dominant patterns each carry different tradeoffs.
| Pattern | Latency | Cost profile | Typical use cases | Idempotency / schema drift risk |
|---|---|---|---|---|
| Batch | Minutes to hours | Low compute, simple infra | Nightly warehouse loads, monthly reporting | Low risk; full replays are straightforward |
| Micro-batch | Seconds to minutes | Moderate; more frequent compute | Near-real-time dashboards, hourly aggregations | Moderate; overlapping windows need deduplication |
| Streaming | Sub-second | Higher; always-on compute | Fraud detection, real-time personalization | High; schema drift can corrupt in-flight records |
| Event-driven | Sub-second to seconds | Variable; scales to zero between events | Webhooks, CDC-triggered transforms, alerting | High; event ordering and exactly-once delivery require explicit design |
Enterprise automation is moving from schedule-based jobs toward event-driven, autonomous systems that reduce time-to-insight and handle schema drift proactively. That shift is real, but it doesn't mean every team should rewrite their batch jobs as streaming pipelines.
Choosing a pattern: four questions to answer first.
- What is the maximum acceptable lag between a source event and a consumer seeing it?
- Does the downstream consumer (a dashboard, a model, an API) actually need sub-minute freshness?
- Can the source system emit events, or does it only support bulk exports?
- Does the team have operational experience with stream processing runtimes?
If the answer to question 2 is no, batch or micro-batch is almost always the right call — streaming infrastructure adds operational complexity that isn't justified by a dashboard that refreshes every 15 minutes. Hybrid patterns (batch for historical backfill, streaming for incremental updates) work well when you need both low-latency current data and cost-efficient historical processing. Apache Kafka is the most common durable event log underpinning event-driven and streaming architectures, providing the replay capability that makes exactly-once semantics achievable.
Which tooling categories do you need for automated pipelines?
No single tool covers the full pipeline lifecycle. The stack is assembled from categories, and the managed-vs-self-hosted decision for each category has real cost and operational implications.
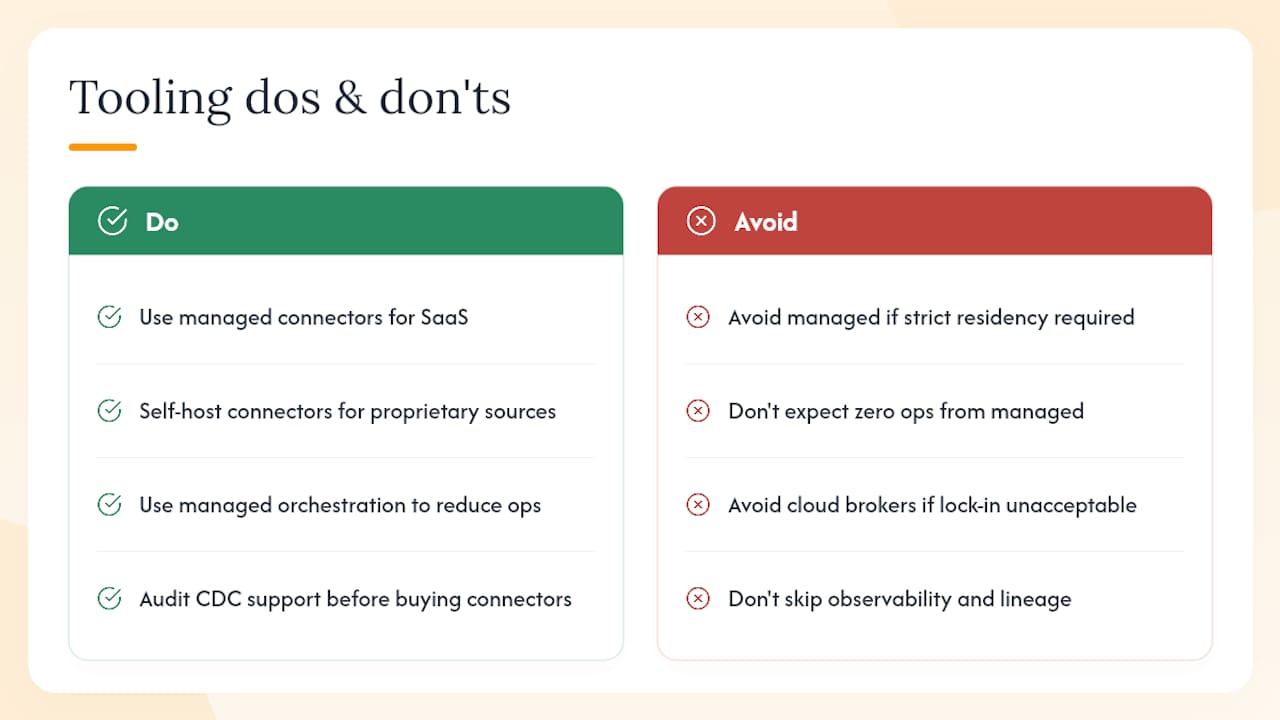
Connectors / CDC tools extract data from source systems. Managed options reduce connector maintenance overhead significantly; self-hosted gives you control over data residency and custom source support. Use managed when your sources are standard SaaS systems; self-host when you have proprietary databases or strict data residency requirements.
Orchestrators coordinate task execution, retries, and SLA enforcement. Apache Airflow (DAG-based, widely adopted, self-hosted or managed) is the reference implementation for dependency-aware scheduling. Prefect and Dagster offer more Python-native APIs with built-in observability. Managed orchestration reduces the operational burden of running the scheduler itself but limits customization.
Transformation frameworks apply business logic. dbt (data build tool) has become the standard for SQL-based ELT transformations in the warehouse, with built-in testing and lineage. Apache Spark's Structured Streaming provides a unified batch/stream programming model for teams that need scalable transformations outside the warehouse. Apache Flink handles stateful stream processing with low-latency semantics for complex event processing.
Message systems / stream brokers decouple producers from consumers and provide durable event logs. Apache Kafka is the dominant choice; cloud-managed equivalents (Amazon Kinesis, Google Pub/Sub) reduce operational overhead at the cost of vendor lock-in.
Storage targets include cloud data warehouses (Snowflake, BigQuery, Redshift), data lakes (S3, GCS with Delta Lake or Apache Iceberg), and operational databases. The choice of storage format directly affects transformation performance and schema evolution handling.
Observability and metadata stores track pipeline health, data quality, and lineage. OpenLineage provides a vendor-neutral lineage standard; DataHub and Apache Atlas are open-source metadata platforms. Enterprise orchestration platforms emphasize observability and SLA enforcement as first-class requirements, not optional add-ons.
Pro Tip: Before evaluating any managed connector service, audit your source systems for CDC support. A source that only supports full-table exports will drive up compute and storage costs regardless of how good your orchestrator is.
How to automate data pipelines: an implementation checklist
A 4–8 week pilot covering one to two pipelines is the right scope for a first automated deployment. The goal is to validate tooling choices and observability patterns before scaling.
1. Map sources and define data contracts. Document every source system, its schema, expected volume, and the SLA it can realistically commit to. Write contracts before writing code — they become the test assertions that run in production.
2. Choose your processing pattern. Answer the four latency/cost questions from the types section. Resist the pull toward streaming unless the business case is clear.
3. Select and configure your tooling stack. Pick one orchestrator, one transformation framework, and one observability tool. Avoid assembling five tools for a two-pipeline pilot — complexity compounds.
4. Define tests and quality assertions. Write row-count checks, null-rate assertions, and referential integrity tests as part of the pipeline definition, not as a separate QA step. dbt tests or Great Expectations are standard choices.
5. Set SLAs and configure alerting. Define what "late" means for each pipeline (e.g., data must be available by 6:00 AM UTC). Configure alerts that fire before the SLA is breached, not after consumers notice.
6. Version everything as code and wire CI/CD. Transformation logic, DAG definitions, and quality assertions all live in version control. A CI pipeline runs tests on every pull request; deployment to production is automated on merge to main. Treating automation definitions as code — versioned, tested, and deployed via CI — is the operational practice that separates mature pipelines from fragile ones.
7. Run a pilot with synthetic and real data. Execute the pipeline against a staging environment with production-representative data volumes. Measure freshness lag, error rates, and resource consumption.
8. Iterate and scale. Tighten SLAs based on pilot observations, add sources incrementally, and document runbook items (retry logic, escalation paths, reprocessing procedures) before handing off to on-call rotation.
Pro Tip: Wire your alerting to a Slack channel from day one of the pilot, not after go-live. You'll catch configuration issues faster and build the team's intuition for what normal pipeline behavior looks like before it matters.
Operational best practices and anti-patterns for production pipelines
Mature automated pipelines share a set of operational properties that reduce incidents and maintenance overhead. The anti-patterns below are the most common sources of 3 AM incidents.
Do:
- Design for idempotency. Every pipeline run should produce the same result whether it executes once or ten times. This means using upserts rather than appends for most loads, and partitioning raw data by source timestamp so replays overwrite rather than duplicate.
- Enforce data contracts at ingestion. Validate schema and semantics at the point of entry, not downstream. A contract violation caught at ingestion is a configuration fix; one caught at the dashboard is a data incident.
- Handle schema drift automatically. Build schema evolution logic into your connectors and transformation layer — additive changes (new nullable columns) should be handled without human intervention; breaking changes should trigger an alert and halt the affected pipeline.
- Embed testing in the pipeline. Quality assertions run as pipeline tasks, not as separate jobs. A failed assertion stops the pipeline before bad data reaches consumers.
- Use metadata-driven reprocessing. When a transformation bug is fixed, reprocess only the affected partitions using lineage metadata rather than replaying the entire history. This cuts reprocessing time and compute cost significantly.
- Treat observability as a data product. Publish pipeline health metrics (freshness, row counts, error rates) to the same observability layer as application metrics so on-call engineers have a single pane of glass.
Anti-patterns to refactor:
- Ad-hoc cron scripts. A
crontabentry that runs a Python script with no retry logic, no alerting, and no version control is a pipeline in disguise — and a fragile one. Migrate these to your orchestrator with proper dependency tracking and failure handling. - Point-to-point brittle integrations. A direct database-to-database script that hardcodes connection strings and column names breaks on the first schema change. Replace with a connector layer that handles schema evolution and a transformation layer that references columns by contract, not by position.
- Manual handoffs between pipeline stages. If an engineer needs to run a script to "kick off the next step," that handoff is a reliability gap. Every stage transition should be automated and logged.
- Lineage as an afterthought. Teams that skip lineage during initial build spend weeks reconstructing it after the first data incident. Add lineage instrumentation from the first pipeline, not the tenth.
How agent-based orchestration augments pipeline automation
The architecture is straightforward: a lead agent receives an intent (e.g., "create a pipeline from Salesforce to Snowflake that syncs opportunities on close") and decomposes it into tasks — connector configuration, schema mapping, transformation logic, test generation, and deployment. Specialized worker agents execute each task inside isolated containers, with shared context and metadata accumulating across runs. Agentic approaches accelerate connector creation and remediation by generating and sandboxing changes, but they require runtime guarantees — exactly-once semantics, schema enforcement — to be trusted in production.
Concrete benefits of this pattern:
- Faster connector generation. A worker agent can draft a custom API integration, test it against a sandbox, and propose the configuration for human review in minutes rather than days.
- Automated remediation. When a quality assertion fails, an agent can diagnose the failure (schema drift, upstream volume drop, transformation bug), propose a fix, and route it through an approval workflow before touching production.
- Intent-driven pipeline creation. Engineers describe what data should flow where; the agent handles the scaffolding. This shifts engineering effort from boilerplate to review and validation.
- Self-healing runs. Agents monitor execution, detect infrastructure noise (transient network failures, rate limits), and retry with backoff — distinguishing recoverable failures from logic bugs without human triage.
A typical agent-orchestrated flow looks like this: the lead agent parses the pipeline specification, creates a task graph (structurally similar to a DAG but with dynamic branching based on runtime state), and dispatches tasks to workers. Each worker operates in its own container with no shared mutable state, which makes failures isolated and reproducible. State machine orchestration can be more expressive than pure DAGs for these dynamic flows, particularly when a pipeline step needs to wait for an external approval or a conditional branch based on data quality results.
The shared context layer is what makes this more than parallel execution — workers write observations (schema snapshots, row count deltas, error signatures) back to a shared metadata store, and the lead agent uses that context to make routing decisions on subsequent runs. Over time, the system builds procedural memory about which sources are unreliable, which transformations are expensive, and which quality checks have historically fired false positives.

How should you handle errors and recovery in automated pipelines?
Error handling in automated pipelines falls into three categories: transient infrastructure failures, data quality failures, and logic bugs. Each requires a different recovery strategy.
Transient failures (network timeouts, API rate limits, temporary unavailability) should be handled with exponential backoff and configurable retry limits at the task level. The orchestrator manages this automatically when retry policies are defined in the DAG or workflow definition. Infrastructure noise accounts for a significant share of agent and pipeline failures — retrying with backoff resolves most of them without human intervention.
Data quality failures should halt the pipeline at the point of detection and trigger an alert with enough context for an engineer to diagnose the issue: which assertion failed, what the expected vs. actual values were, and which upstream source is the likely cause. The pipeline should not proceed to downstream consumers until the quality issue is resolved or explicitly overridden.
Logic bugs require a fix-and-reprocess cycle. The fix goes through CI/CD (tested against staging data before production deployment), and reprocessing uses metadata-driven selective replay — only the partitions affected by the bug are reprocessed, not the full history. This is where lineage pays for itself: without it, identifying the affected partitions requires manual investigation.
Operational runbook items every team should define before go-live:
- Maximum retry count and backoff interval per task type
- Alert routing: who gets paged for a quality failure vs. an infrastructure failure
- Reprocessing procedure: how to trigger a selective replay and who approves it
- SLA breach escalation path: what happens when a pipeline misses its delivery window
Common data pipeline automation patterns in industry
CDC-to-warehouse pattern. A financial services team uses Change Data Capture on a PostgreSQL transactional database to stream row-level changes into a Kafka topic. A consumer reads from Kafka, applies deduplication and type normalization, and upserts into Snowflake. The pipeline runs continuously; the orchestrator monitors consumer lag and alerts when lag exceeds a defined threshold. This pattern is common in any domain where transactional data needs to be available for analytics within minutes of being written.
ELT with dbt and a cloud warehouse. A SaaS company extracts data from Salesforce, HubSpot, and a product database into a raw schema in BigQuery using a managed connector service. dbt models transform raw tables into a dimensional model, with tests running on every model build. The orchestrator schedules dbt runs after each connector sync completes, using DAG dependencies to enforce ordering. This is the dominant pattern for analytics engineering teams today.
Event-driven microservice pipeline. An e-commerce platform publishes order events to Kafka. Multiple downstream consumers — inventory, finance, personalization — each maintain their own materialized view, updated in real time as events arrive. Schema Registry enforces the event schema; a breaking change to the order event schema requires a versioned migration before any consumer is updated. This pattern requires careful schema governance but delivers sub-second data freshness across all consumers.
Batch ML feature pipeline. A machine learning team runs a nightly batch job that reads from the data warehouse, computes feature vectors, and writes them to a feature store. The orchestrator handles dependency on the upstream warehouse refresh completing successfully. Quality checks validate feature distributions against historical baselines before the feature store is updated — a distribution shift triggers an alert rather than silently poisoning model inputs.
Multi-source aggregation with custom API integrations. A growth team needs data from a mix of standard SaaS tools and internal APIs that don't have pre-built connectors. Worker agents generate custom API integrations for the non-standard sources, test them in a sandbox, and route them through a review step before production deployment. The orchestrator treats these custom connectors identically to standard ones — same retry logic, same observability, same lineage tracking.
What to consider when integrating legacy systems and cloud services
Legacy systems present three specific challenges: they often lack CDC support, their schemas are poorly documented, and their availability windows constrain pipeline scheduling. The practical approach is to treat legacy sources as read-only, extract via full or incremental bulk exports on a schedule the source system can support, and land data in a raw staging zone before any transformation. Never write transformation logic that depends on the legacy system's internal schema directly — abstract it behind a contract layer so schema changes in the source require only a contract update, not a transformation rewrite.
Cloud service integration is generally more tractable because managed APIs and webhooks are standard. The main consideration is rate limiting: cloud APIs enforce request quotas that batch extractors can hit during large historical syncs. Design extractors with configurable concurrency limits and exponential backoff, and separate historical backfill jobs from incremental sync jobs so a backfill doesn't starve the incremental pipeline.
For hybrid architectures that span on-premises systems and cloud services, the network boundary is the primary operational concern. A VPN or private link between on-prem and cloud avoids routing sensitive data over the public internet, and a staging zone in the cloud (rather than direct on-prem-to-warehouse writes) gives you a buffer for schema validation before data enters the warehouse. Access control at the staging zone boundary — service accounts with least-privilege permissions, secrets managed via a vault rather than environment variables — is the governance item most teams skip in the initial build and regret later.
Schema evolution handling differs between legacy and cloud sources. Cloud SaaS vendors typically version their APIs and provide migration guides; legacy systems change schemas without notice. Automated schema drift detection at the connector layer — comparing the incoming schema against the registered contract on every run — catches breaking changes before they propagate downstream.
The 30–90 day operational perspective
The first two weeks after go-live are diagnostic. We watch freshness lag on every pipeline, not just the ones we expect to be slow. We watch retry rates by task type — a connector task that retries three times per run isn't a crisis, but it's a signal that the source system is under load or the network path is unreliable. We fix the small things immediately: a retry limit that's too low, an alert threshold that fires on normal variance, a quality check that's too strict for the data's actual distribution.
By day 30, the focus shifts to cost and SLA tightening. We look at compute spend per pipeline and identify the jobs that are over-provisioned — a transformation that runs on a large cluster for two minutes doesn't need that cluster. We also look at which SLAs we set conservatively during the pilot and tighten them to reflect actual observed latency. Right-sizing worker containers based on actual CPU and memory graphs from the first month of production runs typically reduces compute spend without affecting throughput.
The 30–90 day checklist:
- Days 1–14: Validate all alerting paths (fire a test alert for each pipeline), confirm retry logic resolves transient failures without human intervention, document any quality checks that fired false positives and tune thresholds.
- Days 15–30: Review compute spend by pipeline, right-size resources, tighten SLAs based on observed p95 latency, and confirm lineage is capturing all transformation steps.
- Days 31–60: Add the second and third pipeline to the automated system, validate that the orchestrator handles cross-pipeline dependencies correctly, and run a tabletop exercise for a data incident (simulate a quality failure and walk through the runbook).
- Days 61–90: Audit access controls (who has write access to the raw staging zone, are service account permissions scoped correctly), verify data masking is applied before data leaves the staging zone, and confirm retention policies are enforced automatically.
Governance and security items to verify before day 30: service accounts use least-privilege permissions, secrets are stored in a vault (not in DAG definitions or environment variables), PII fields are masked in the staging zone before transformation, and audit logs are retained per your organization's policy.
Agent-swarm handles the orchestration layer you don't want to build yourself
The hardest part of production pipeline automation isn't writing the first DAG. It's the second year: new sources, schema changes, custom connectors for internal APIs, and the growing list of pipelines that need monitoring, retries, and occasional reprocessing. That's exactly where Agent-swarm fits.
Agent-swarm is an open-source AI work operating system that runs a lead agent to decompose pipeline objectives into tasks, dispatches them to specialized workers in isolated Docker containers, and accumulates shared context across runs. For data teams, that means automated connector generation, schema drift remediation routed through approval workflows, and cross-system orchestration across Slack, GitHub, Linear, and custom APIs — without building the scaffolding yourself. Workers operate statelessly, failures are isolated, and the shared memory layer means the system gets better at your specific pipeline patterns over time. Self-hosted (MIT license) or cloud SaaS, depending on your deployment constraints. Start with the free self-hosted tier or explore the cloud plan to see how it fits your current stack.
Sources
- Types of data pipelines and the benefits of using them
- Statista – worldwide data created
- Apache Airflow — DAGs documentation
- Apache Kafka
FAQ
Is a data pipeline the same as ETL?
No. ETL (Extract, Transform, Load) is one processing pattern a pipeline can implement. A data pipeline is the broader system that orchestrates ingestion, transformation, delivery, testing, and governance — it may use ETL, ELT, or streaming patterns depending on the use case.
Will AI replace ETL?
AI augments ETL rather than replacing it. Agentic systems can generate connector configurations, detect schema drift, and propose transformation logic, but the underlying extract-transform-load operations still run on deterministic, tested code. The human role shifts from writing boilerplate to reviewing and validating agent-generated changes.
How do you automate an ETL pipeline?
Define your transformation logic and DAG dependencies as code, version them in Git, run quality assertions as pipeline tasks, and deploy via CI/CD. Tools like Apache Airflow handle scheduling and retries; dbt handles SQL transformations with built-in testing. The pilot checklist in this article covers the full sequence from source mapping to production rollout.
Can AI create data pipelines?
Yes, with guardrails. Agent-swarm, for example, uses a lead agent to decompose a pipeline specification into tasks and dispatches workers to generate connector configurations, transformation logic, and quality checks — each sandboxed and routed through a review step before touching production. The output is proposed code and configuration, not autonomous production deployment without human approval.
Recommended
- Building a DAG Workflow Engine That Waits: Pause, Resume, and Convergence Gates | agent-swarm.dev
- Why We Ditched DAGs for State Machines in Agent Orchestration | agent-swarm.dev
- Your AI Workflow Has Too Many Agents | agent-swarm.dev
- Script Workflows: Durable One-off Runs for Agent Work | agent-swarm.dev
Related field notes
We Rebuilt Linear's “Loops updates” Clip as a Swarm Video in Eight Rounds
Three video models read Linear's motion-design teaser; the two Gemini models called the 3D scene 2D until 7.5s. A frame-by-frame check caught it. The replica is 858 frames of Remotion and three.js, reviewed eight times.
SEO con agentes IA: guía práctica para automatizar sin perder el control
Aprende a automatizar tareas SEO con agentes de IA sin perder el control: define reglas, supervisa aprobaciones y gana tiempo para estrategia.
Pick Best AI Workflow Automation That Preserves Memory for Engineers
Engineering first guide to AI workflow automation: pilot plan to prove ROI and why agent-swarm.dev fits teams needing persistent memory.