Incident Response Automation for SRE and DevOps Teams
Discover how incident response automation streamlines operations for SRE and DevOps teams, enhancing efficiency and reducing downtime.

Incident response automation for SRE/DevOps is the practice of wiring alert signals into a multi-agent pipeline that triages, assigns, remediates, verifies, and closes production incidents without requiring a human to coordinate each handoff. The recommended outcome is a closed-loop, auditable pipeline where agents act, confirm success, and either close the incident or escalate with a full evidence trail.
- Triage: classify severity, enrich with telemetry, assign ownership
- Remediation: retrieve the matching runbook, execute governed steps
- Verify + close: confirm the fix held, seal the evidence, close the ticket
Agent-swarm.dev implements this architecture out of the box, with isolated worker containers, RAG-powered runbook retrieval, and native integrations for Slack, GitHub, and Linear.
Key Takeaways
Multi-agent, closed-loop incident automation is the most reliable path to sustained MTTR reduction for SRE teams, and it requires five components to work in production: shared durable state, strict per-role ACLs, RAG-powered runbook retrieval, human-in-the-loop gates by severity, and SHA-256-sealed audit trails.
| Point | Details |
|---|---|
| Closed-loop verification is mandatory | Every remediation step needs a verifier; without it, automation closes tickets on failed fixes. |
| Shared state over prompt chaining | Store incident facts under a single incident_id so agents resume rather than re-investigate. |
| Salesforce's 70–80% MTTR reduction | Automated prioritization and runbook execution cut common S2 resolution time by approximately 70–80%. |
| Dry-run before live execution | Run every new runbook against synthetic alerts in dry-run mode before enabling production execution. |
| Agent-swarm as the MVI platform | Agent-swarm provides orchestration, isolated containers, RAG memory, and native integrations to build the full pipeline. |
Table of Contents
- What incident response automation actually solves for SRE teams
- Core architecture: multi-agent patterns, role separation, and closed-loop flows
- Which integrations and telemetry sources does your automation actually need?
- Safety-first controls: policy engine, human-in-the-loop, and audit trails
- Step-by-step checklist to build a minimal viable incident automation
- A concrete end-to-end example: alert to close
- How to measure success and keep automation healthy
- Self-hosted vs. cloud SaaS: deployment trade-offs and cost drivers
- When you should not automate an incident type
- How Agent-swarm maps to this architecture
- The part most teams skip until it costs them
- Agent-swarm handles the architecture so your team handles the exceptions
- Sources
- FAQ
What incident response automation actually solves for SRE teams
Manual incident handling has three compounding failure modes: alert storms that bury the signal, triage latency while engineers context-switch from feature work, and inconsistent remediation because whoever is on-call applies their own judgment to a runbook they may not have read recently. Automated incident management closes each of those gaps by making the pipeline deterministic and measurable.
Salesforce's Agentforce-powered Incident Command Deputy combined anomaly detection, agent-based evidence collection, and automated runbook execution to significantly reduce common Severity-2 resolution time. That result came from removing the human coordination layer for well-understood incident classes, not from replacing human judgment on novel failures.
The metrics that matter most: mean time to resolution (MTTR), automation coverage (the percentage of incident types with a fully automated path), diagnosis confidence (how often the triage agent selects the correct runbook on the first attempt), and false positive rate (automated actions triggered on non-incidents).
Core architecture: multi-agent patterns, role separation, and closed-loop flows
A production-grade automated incident management system follows a single data flow: alert → shared state → specialist agents → policy guard → action → verification → close (or retry/escalate).
RushDB's design stores alerts, tickets, docs, goals, observations, and handoffs as linked records under a single incident_id, so agents resume from durable state rather than replaying prompt history. This prevents repeated re-investigation on restarts and preserves evidence linkages across agent handoffs.
The five core agent roles are:
- Monitor/Triage agent: ingests alert payloads, classifies severity (P0–P3), enriches with recent telemetry
- Analyser/Decider agent: correlates symptoms, selects candidate runbooks via RAG retrieval
- Team Manager/Assignment agent: routes the incident to the correct team or on-call rotation
- Remediation/Commander agent: executes runbook steps with governed tool access
- Verifier/Report agent: confirms the fix held, seals the evidence record, closes or escalates
For assignment, Microsoft Research's Triangle system demonstrates that a voting-based multi-agent negotiation mechanism with semantic distillation and team-information enrichment improves triage and reassignment accuracy at scale, particularly when ownership is ambiguous across service boundaries.
Underpass's memory-plus-execution plane pattern separates context rehydration (the kernel that restores exact agent state) from governed tool execution (the runtime that enforces ACLs), which makes audits and reproductions tractable in live incidents.
Pro Tip: Enforce strict per-role runtime tool allowlists at the agent layer, not just the API layer. A triage agent that can accidentally call a destructive remediation endpoint is a blast-radius risk, not a convenience.
Which integrations and telemetry sources does your automation actually need?
| Integration | What to ingest | Why it matters |
|---|---|---|
| Alerting (PagerDuty, Prometheus) | Alert payload, severity, labels | Entry point; drives triage classification |
| Metrics/traces/logs (Grafana, OTEL) | Time-series, spans, structured logs | Enriches triage; feeds RAG context window |
| Code metadata (GitHub) | Recent commits, PR authors, CODEOWNERS | Identifies likely owners; informs assignment |
| Issue tracker (Linear) | Open incidents, team assignments, SLOs | Prevents duplicate tickets; tracks closure |
| Chat (Slack) | Channel history, on-call mentions | Human-in-the-loop gate; status broadcasts |
| CI/CD pipeline | Deploy events, rollback state | Correlates incidents with recent changes |
Runbook retrieval quality depends on how you index this data. Hybrid RAG pipelines combining BM25 sparse retrieval with semantic search and cross-encoder reranking consistently outperform single-method retrieval on diagnosis confidence. Store runbooks with structured metadata (service name, alert type, severity band) so the reranker has signal beyond raw text similarity. Webhook payloads should be normalized at ingestion; inconsistent field names across alerting tools are the most common cause of triage agent misclassification.
Safety-first controls: policy engine, human-in-the-loop, and audit trails
Automation that acts without guardrails is operationally worse than no automation, because it fails at scale and at speed; implementing Replit SEO Autopilot: Content, Backlinks & Audit can help optimize automation tooling and streamline content workflows. The control stack has four layers.
Policy engine: define immutable safety rules before any agent executes a mutating operation. Opsbench's approach uses Cedar policies and JSON schema validation on agent outputs, so a malformed or out-of-scope action is rejected before it reaches the tool layer. Dry-run mode, where the agent plans the full remediation sequence but executes nothing, is the minimum viable safety check before any new runbook goes live.
Human-in-the-loop gating by severity:
- P0 (full outage): require explicit human approval before any mutating step
- P1 (partial degradation): auto-execute low-blast-radius steps; gate destructive ones
- P2/P3 (degraded performance, minor): fully automated with post-hoc review
Circuit breakers: Orrery's design caps retries on remediation loops and halts execution if the verifier reports repeated failure, routing the incident to a human with the full evidence record attached.
Audit trail: every agent action, tool call, and decision branch should write to a tamper-evident log. SHA-256 sealing of the evidence manifest at incident close creates a forensic chain of custody that survives post-incident review and, where relevant, compliance audits.
Pro Tip: Per-role runtime ACLs are your last line of defense. Triage agents should never hold credentials that allow them to delete resources, restart services, or modify infrastructure state.
Step-by-step checklist to build a minimal viable incident automation
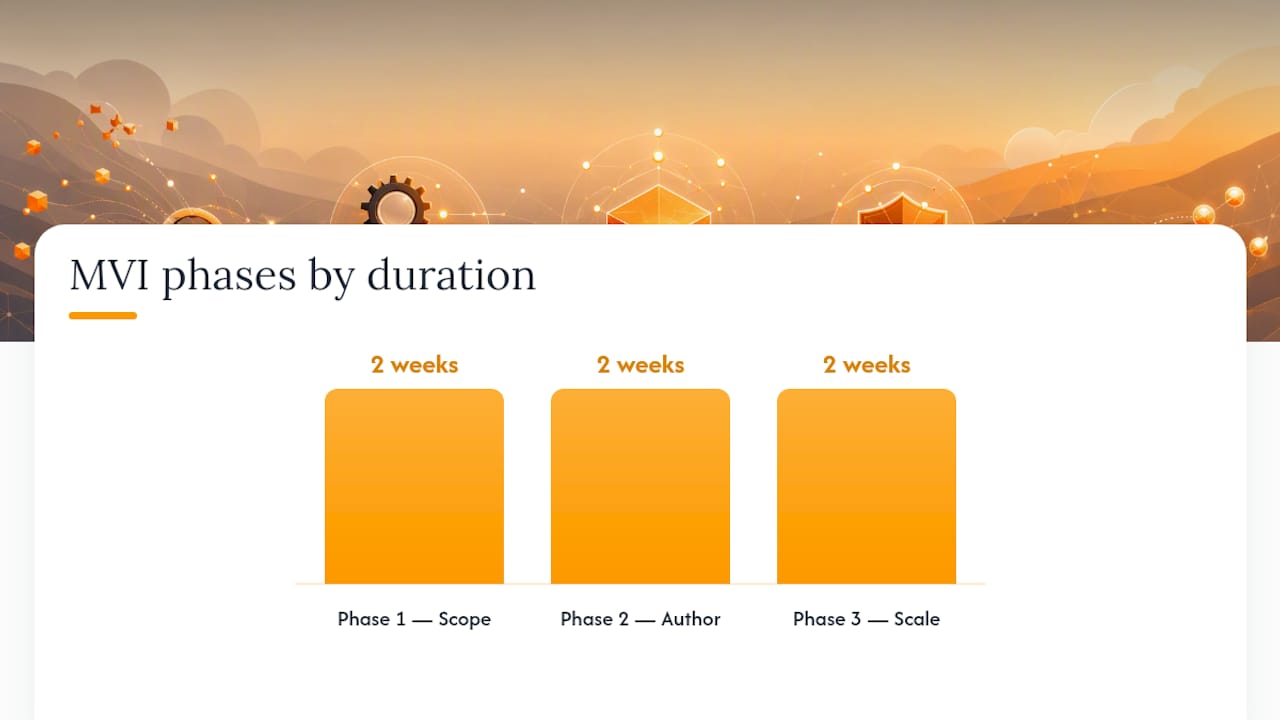
A minimal viable incident automation (MVI) can reach production in roughly six weeks for a small platform team, broken into three phases.
Phase 1 — Scope and map (weeks 1–2):
- Select two or three high-frequency, low-blast-radius incident types (pod OOM kills, certificate expiry, disk saturation)
- Map each alert type to an existing runbook; identify gaps
- Wire Prometheus/Grafana and PagerDuty as alert sources; connect Slack and Linear as output channels
Phase 2 — Author and gate (weeks 3–4): 4. Author verifiable runbook steps (each step has a success condition the verifier can check) 5. Set approval policies per severity band (P0 requires human approval; P2/P3 fully automated) 6. Enable dry-run mode; run synthetic alerts against every new runbook before enabling live execution
Phase 3 — Scale and iterate (weeks 5–6): 7. Run chaos tests (inject synthetic failures; confirm agents triage, remediate, and close correctly) 8. Audit the evidence trail for completeness and SHA-256 integrity 9. Expand runbook coverage to the next five incident types based on frequency data
Durable script workflows are a practical pattern for the dry-run phase: the agent executes the full remediation sequence in a sandboxed context, logs every planned action, and exits without touching production state.
A concrete end-to-end example: alert to close
Here is a realistic pod OOM kill incident walking through the full pipeline:
- T+0s — Alert fires: Prometheus fires
KubePodOOMKilledwith labelsnamespace=payments,pod=checkout-7d9f. PagerDuty routes to the triage agent via webhook. - T+5s — Triage: The triage agent classifies P2, enriches with Grafana memory metrics (spike 15 minutes prior), and queries GitHub CODEOWNERS to identify the payments team.
- T+15s — Runbook retrieval: The analyser runs hybrid RAG retrieval plus cross-encoder reranking across indexed runbooks. Top result:
oom-kill-memory-limit-increase.mdwith confidence score above threshold. - T+20s — Assignment: The team manager agent opens a Linear ticket, pages the payments on-call via Slack, and attaches the enriched context.
- T+45s — Remediation: The commander agent executes the runbook: patches the deployment memory limit via the Kubernetes API (P2, no human approval required), then posts the action to the Slack incident channel.
- T+60s — Verification: The verifier polls pod status for up to 120 seconds. Pod restarts successfully; memory metrics normalize.
- T+90s — Close: Verifier seals the SHA-256 evidence manifest, updates the Linear ticket to "resolved," and posts a summary to Slack. If the pod had failed to restart, the circuit breaker would have halted retries and escalated to a human with the full evidence record.
How to measure success and keep automation healthy
Primary KPIs to track weekly:
- MTTR (mean time to resolution): compare automated vs. manual incident cohorts
- Automation coverage: percentage of incident types with a fully automated remediation path
- Diagnosis confidence: rate at which the triage agent selects the correct runbook on the first attempt
- False positive rate: automated actions triggered on non-incidents
- Approval latency: time between a human-gate request and approval (a proxy for on-call friction)
Operational cadence: weekly runbook reviews to catch drift between runbook steps and current infrastructure state; monthly dry-runs against the full runbook library; quarterly blast-radius audits to verify that ACLs and policy rules still match the current service topology. The task state machine recovery pattern is worth reviewing when diagnosing why specific incident types consistently fall back to human escalation.
Self-hosted vs. cloud SaaS: deployment trade-offs and cost drivers
The choice between self-hosted and cloud SaaS for incident automation turns on three variables: data residency requirements, operational ownership capacity, and inference cost at your incident volume.
Self-hosted gives you full control over agent credentials, network isolation, and audit log retention. The cost is operational: you own the LLM inference infrastructure, container orchestration, and the upgrade cycle. Cloud SaaS trades that control for managed infrastructure, faster onboarding, and vendor-handled scaling, but your incident telemetry transits the vendor's network.
Cost drivers to model before committing:
- LLM inference: the largest variable cost; triage and analysis agents are token-heavy
- Tool execution: mutating operations (API calls, kubectl patches) may carry per-call pricing on managed platforms
- Telemetry volume: log and metric ingestion for RAG context windows scales with incident frequency
- Audit storage: SHA-256-sealed evidence manifests accumulate; size them against your retention policy
- Human approval latency: on SaaS platforms, approval gate UX affects on-call friction more than raw cost
For a medium-sized platform team handling roughly 50–200 incidents per month, the dominant cost is LLM inference during triage and runbook selection, not storage or tool execution. See evaluation criteria across deployment models to compare orchestration trade-offs before committing to a stack.
When you should not automate an incident type
Not every incident class is ready for automation. The risk red flags that should keep a workflow manual or heavily gated:
- High blast radius: any action that modifies shared infrastructure (database schema changes, load balancer rule updates, DNS modifications) without a tested rollback path
- Insufficient runbook coverage: if the remediation steps are undocumented or inconsistently applied by humans, agents will amplify the inconsistency
- Sparse observability: if the verifier cannot confirm success because the relevant metrics are missing or delayed, the closed loop cannot close
- Unclear ownership: ambiguous CODEOWNERS or team boundaries cause assignment agents to route incorrectly; fix ownership first
- Regulatory constraints: incidents touching PII, financial records, or audit-sensitive systems may require documented human review before any automated action
The coordination anti-patterns article covers how multi-agent systems reproduce organizational ownership problems at machine speed, which is the most common reason a well-designed automation pipeline still fails in production.
How Agent-swarm maps to this architecture
Agent-swarm implements each component of the recommended pipeline as a first-class feature:
| Architecture component | Agent-swarm feature |
|---|---|
| Multi-agent orchestration | Lead agent decomposes incidents into tasks; assigns to specialist workers |
| Isolated execution | Each worker runs in a Docker container with scoped credentials |
| Runbook retrieval (RAG) | Persistent shared memory with contextual knowledge compounding across incidents |
| Human-in-the-loop gates | Approval workflows configurable per severity band |
| Audit trail | Immutable task and action logs with evidence linkage per incident |
| Slack/GitHub/Linear | Native integrations; webhook ingestion and outbound posting included |
Quickstart checklist:
- Install Agent-swarm (self-hosted via Docker or cloud SaaS)
- Wire Slack (incoming alerts) and GitHub (CODEOWNERS, commit metadata)
- Connect Linear as the issue tracker output channel
- Author one runbook with a verifiable success condition
- Enable dry-run mode and fire a synthetic alert to validate the full pipeline before going live
Browse real Agent-swarm sessions to see the pipeline running against actual incident types, or read the Capchase case study for a production deployment reference.
The part most teams skip until it costs them
We have watched teams build technically sound automation pipelines and then grant every agent broad credentials "just to get it working." The blast-radius event that follows is not a matter of if. Dry-runs are not optional; they are the only way to discover that your remediation runbook patches the wrong deployment label before it does so in production at 2 AM. The other consistent mistake is automating incident types before the runbooks are stable. Agents amplify whatever process they encode, consistent or not.
Agent-swarm handles the architecture so your team handles the exceptions
Most incident automation projects stall at the integration layer: wiring Slack, GitHub, Linear, and your observability stack into a coherent pipeline takes weeks before a single runbook runs. Agent-swarm collapses that to a day.
- Isolated Docker containers per worker, so credentials stay scoped and blast radius stays bounded
- Native Slack, GitHub, and Linear integrations with configurable approval gates per severity band
- Persistent shared memory that compounds runbook knowledge across every incident the swarm handles
The fastest path to a live MVI is a real Agent-swarm session. If you want a production reference before committing, the Capchase case study shows the full deployment pattern.
Sources
- TRIANGLE_FSE25.pdf
- How Agentforce enabled incident response automation to cut common resolution time by 70–80%
- Multi-Agent Incident Response: Shared Memory For AI Agents
FAQ
What is incident response automation for SRE teams?
It is the practice of routing production alerts into a multi-agent pipeline that triages, assigns, remediates, verifies, and closes incidents without manual coordination at each handoff. The pipeline is closed-loop: agents confirm each fix held before marking the incident resolved.
How much can automated incident management reduce MTTR?
What safety controls does incident automation require?
At minimum: per-role runtime ACLs, a policy engine with dry-run mode, human-in-the-loop approval gates for P0/P1 severity, circuit breakers on remediation retries, and SHA-256-sealed audit logs for every agent action.
How does Agent-swarm support this architecture?
Agent-swarm provides isolated Docker containers per worker, persistent shared memory for runbook RAG, configurable approval gates, and native integrations for Slack, GitHub, and Linear, covering every component of the recommended pipeline.
When should an incident type stay manual?
Keep incidents manual when runbooks are undocumented, observability is too sparse for the verifier to confirm success, ownership is ambiguous, or the blast radius of a failed action is unacceptably high without a tested rollback path.
Recommended
- Nobody Prompt-Injected Our Agents — They Escalated Their Own Privileges | agent-swarm.dev
- Why We Banned 5-Minute Intervals in Our Agent Orchestrator | agent-swarm.dev
- 59% of Agent Failures Are Infrastructure Noise, Not Logic Bugs | agent-swarm.dev
- Devin vs agent-swarm.dev — One Rented Engineer vs an Owned Team
Related field notes
We Rebuilt Linear's “Loops updates” Clip as a Swarm Video in Eight Rounds
Three video models read Linear's motion-design teaser; the two Gemini models called the 3D scene 2D until 7.5s. A frame-by-frame check caught it. The replica is 858 frames of Remotion and three.js, reviewed eight times.
SEO con agentes IA: guía práctica para automatizar sin perder el control
Aprende a automatizar tareas SEO con agentes de IA sin perder el control: define reglas, supervisa aprobaciones y gana tiempo para estrategia.
Pick Best AI Workflow Automation That Preserves Memory for Engineers
Engineering first guide to AI workflow automation: pilot plan to prove ROI and why agent-swarm.dev fits teams needing persistent memory.