Right-sizing your agent swarm without chasing ghosts.
A straight-line CPU climb and a coder worker stuck near 1.1 GB looked like production problems. They were metric interpretation traps. Here are the sizing numbers we actually run.
We had the kind of graph that makes infrastructure teams reach for a rollback: container CPU climbing in a perfect straight line after deploy. At the same time, a coder worker looked stuck above 1 GB of RAM while idle.
Both looked like production problems. Both turned out to be measurement artifacts. The CPU line was an average over a cumulative counter. The memory plateau was page cache plus a long-lived Bun/Node high-water mark. The swarm was fine; the dashboard was asking the wrong question.
The rule is simple: do not resize a swarm because a graph looks scary. First prove the graph is measuring the thing you think it is measuring.
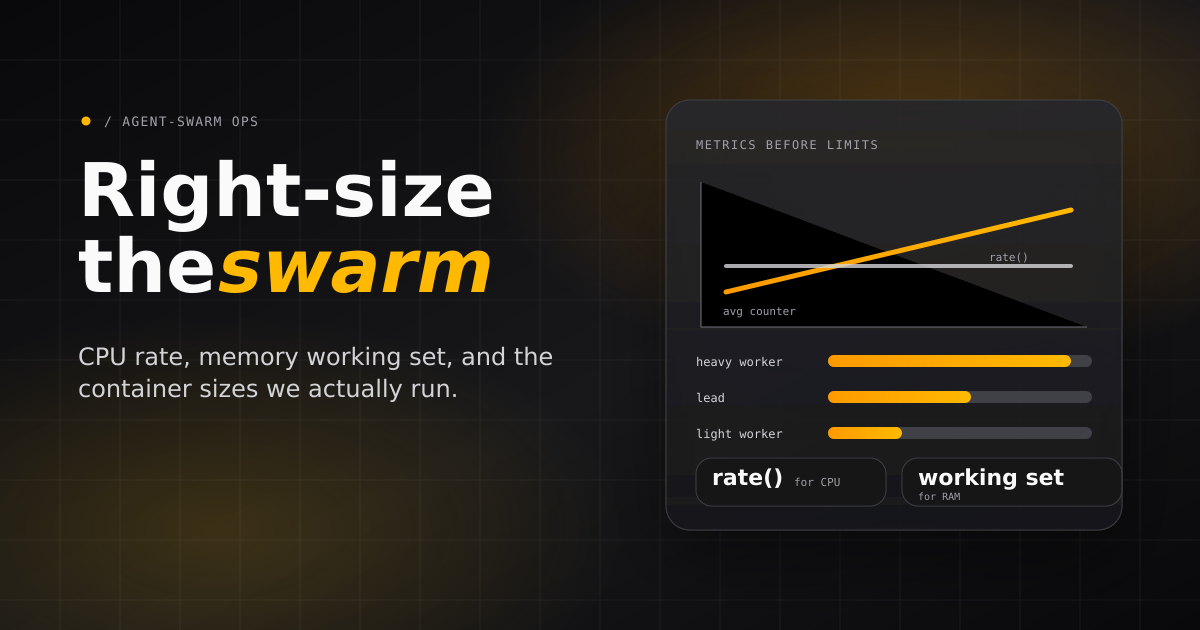
The numbers we actually run
Agent containers do not have one resource profile. A lead agent mostly coordinates. A content worker may sit close to idle. A coding worker can read a repository, spawn a harness process, run TypeScript, execute tests, and stream tool calls for an hour.
Observed peaks around 1.4 CPU cores and 2.0 GB RAM during active coding.
Observed peaks around 0.8 CPU cores and 830 MB while orchestrating.
Idle specialists sit around 3% CPU and 200-290 MB RAM.
That is the practical sizing split: implementation workers get headroom, leads get enough room to coordinate without pressure, and light specialists stay small until their actual workload says otherwise. Role names are a starting point, not a law. If a tester runs browser automation or repo-wide builds, size it like a heavy worker.
Kubernetes pod sizing
In Kubernetes, we set requests to the steady-state budget the scheduler should reserve and limits to the burst ceiling each pod can use during an active session. Heavy workers need the widest gap because build tools, language servers, test runners, and provider subprocesses can spike together.
Kubernetes is stricter about memory bursts than the generated Docker Compose setup I use for single-host deployments. Exceeding limits.memory is an immediate OOMKill, and pods running above requests.memory are the first eviction candidates under node memory pressure. Compose sets no hard memory ceiling by default, so Kubernetes requests should sit near the real working set and limits need real headroom. For a heavy coder, I budget the limit as MAX_CONCURRENT_TASKS * per-session peak (~2 GB) + page-cache headroom; at the default MAX_CONCURRENT_TASKS=1, that is one active task peaking around 2 GB, and raising it multiplies the peak. For the lead, request == limit gives Guaranteed QoS and keeps the orchestrator out of memory-pressure eviction; its observed peak is around 830 MB, so a modest equal request/limit is enough.
| Pod type | Suggested replicas | CPU request | CPU limit | Memory request | Memory limit | Notes |
|---|---|---|---|---|---|---|
| API server | 1-2 | 500m | 1 CPU | 512 MiB | 1 GiB | Run 2 replicas when the database and storage layer support the deployment topology. |
| Lead agent | 1 | 750m | 1.5 CPU | 768 MiB | 1.5 GiB | Coordination-heavy pods benefit from low latency more than high memory. |
| Heavy worker | 1 per pod | 1 CPU | 2 CPU | 2 GiB | 3 GiB | Best default for coding agents, repo-wide checks, and tool-heavy implementation. |
| Light worker | 1 per pod | 250m | 750m | 512 MiB | 1 GiB | Suitable for review, content, triage, and low-build inspection tasks. |
| Browser / E2E worker | 1 per pod | 1 CPU | 2-3 CPU | 2 GiB | 4 GiB | Browser automation and test fixtures need memory headroom beyond normal worker sizing. |
| Worker class | Recommended pod shape | Concurrency per pod (MAX_CONCURRENT_TASKS) | Scaling rule |
|---|---|---|---|
| Heavy coding | 1 agent per pod | 1 active task (default) | Scale by adding pods, not by packing multiple coding sessions into one container. |
| Light specialist | 1 agent per pod | 1 active task (default) | Scale horizontally when queue latency matters. |
| Thin relay / managed-provider worker | 1 agent per pod | 1-2 active tasks | Increase only if the provider runtime executes outside the worker and local tool use is light. |
Docker Compose on a single host
On a single VPS or bare-metal host, we leave reserve capacity for the database, Docker, the kernel page cache, logs, and deploy-time overlap. The practical rule: allocate only 70-80% of host memory to steady-state containers and keep at least 1-2 vCPU uncommitted on busy boxes.
| Service | CPU budget | RAM budget | Replicas | Notes |
|---|---|---|---|---|
| API server | 1 vCPU | 1 GiB | 1 | Keep close to the database. Increase CPU if API latency rises during task churn. |
| Lead agent | 1 vCPU | 1 GiB | 1 | Usually one lead is enough for a small to medium swarm. |
| Heavy worker | 2 vCPU burst | 2-3 GiB | By host capacity | Count each active coding worker as the main unit of capacity. |
| Light worker | 0.5-1 vCPU | 512 MiB-1 GiB | By host capacity | Good filler capacity after heavy workers are reserved. |
| Observability / proxy / support services | 0.5-1 vCPU | 512 MiB-2 GiB | 1 each | Include these before calculating worker slots. |
| Example host class | Approx. host resources | Recommended swarm shape | Notes |
|---|---|---|---|
| Small VPS | 4 vCPU / 8 GiB RAM | API + lead + 1 heavy worker + 1-2 light workers | Good for evaluation, demos, and low-concurrency self-hosting. |
| Medium VPS | 8 vCPU / 16 GiB RAM | API + lead + 3 heavy workers + 2-4 light workers | Practical baseline for a small production team. |
| Large VPS / small dedicated host | 16 vCPU / 32 GiB RAM | API + lead + 6-8 heavy workers + 4-8 light workers | Keep 6-8 GiB free for OS cache, logs, deploy overlap, and occasional spikes. |
| Dedicated build host | 32 vCPU / 64 GiB RAM | API + lead + 12-16 heavy workers + light workers as needed | Useful when many workers run tests or builds locally. Split database/storage if API latency or disk I/O becomes noisy. |
Concurrency is the real multiplier
The swarm scales most predictably when each local-runtime worker runs one active task at a time. The knob is MAX_CONCURRENT_TASKS; the generated Docker Compose default is MAX_CONCURRENT_TASKS=1, which means one active task per worker. Increasing per-worker concurrency can work for thin relay workers or low-tool tasks, but it multiplies memory peaks and makes local builds fight inside the same container.
| Concurrency profile | Worker count | MAX_CONCURRENT_TASKS per worker | Total active tasks | Recommended host or cluster budget | When to use |
|---|---|---|---|---|---|
| Evaluation | 1 lead + 1 heavy worker | 1 | 1 | 2-4 vCPU, 4-8 GiB RAM | Trial deployments and occasional coding tasks. |
| Small team | 1 lead + 2-3 heavy workers + 2 light workers | 1 | 4-5 | 8 vCPU, 16 GiB RAM | Several independent tasks per day with room for reviews and content work. |
| Busy team | 1 lead + 6-8 heavy workers + 4 light workers | 1 | 10-12 | 16 vCPU, 32 GiB RAM | Regular parallel implementation, review, and QA loops. |
| High throughput | 1-2 leads + 12-16 heavy workers + 8+ light workers | 1 | 20+ | 32+ vCPU, 64+ GiB RAM or Kubernetes node pool | Sustained task queues where horizontal scale matters more than single-host simplicity. |
| Thin relay workers | Depends on provider | 2 | Varies | Add 512 MiB-1 GiB RAM per extra active task | Only for providers where execution happens outside the worker and local tooling is minimal. |
Trap one: CPU that climbs because the query climbs
The CPU graph that triggered the investigation was suspicious because it was too clean. Real CPU usage jitters. This line rose with mechanical precision and reset on deploy.
The problem was the panel, not the container. It plotted container.cpu.utilization with average time aggregation, treating a cumulative-since-boot counter like an instantaneous usage gauge. Averaging a monotonic counter produces a fake climb by design.
# Wrong mental model:
avg(container.cpu.utilization)

# Better instantaneous CPU:
rate(container.cpu.usage.total)
We fixed the SigNoz Container CPU Percent panel by switching the time aggregation from average to rate. The straight-line climb disappeared. The actual instantaneous CPU was flat.
Trap two: memory that is high but reclaimable
The memory graph was more subtle. Our coder worker plateaued around 1,145 MB at idle, peaked at 1,979 MB during a heavy coding session, and reset to about 470 MB after the next redeploy. That shape can look like a leak if you only stare at container.memory.usage.total.
It was mostly two normal effects stacked together. First, cgroup page cache: coding sessions read and write a lot of files, and Linux keeps file-backed pages around until pressure forces eviction. Second, the high-water mark of a long-lived Bun/Node runner: heap can be reusable inside the runtime without RSS immediately returning to the OS.
# Better leak-triage panel:
working set = usage.total - inactive_file
Total memory still matters for OOM risk. It is not the same as a leak signal. For leak triage, graph working set and look for growth that survives restarts. If the plateau clears on every redeploy, start with page cache and runtime high-water marks before you go hunting through application code.
Harness choice is part of sizing
The harness provider changes the operational risk profile. claude is our most reliable general harness. codex is stable and good for deterministic implementation, review, and structured-output work. pi is fine for content and QA. opencode has produced intermittent session errors within roughly 10 seconds of task start, so we avoid it for determinism-critical workflow nodes.
That is not just reliability bookkeeping. It affects how much headroom you give a container and what work you route there. A Codex or Claude implementation worker gets heavy-worker resources. A content worker can stay light until the workflow adds builds, browser work, or large local processing.
Fix real leaks, then fix the dashboard
The same operational thread did uncover real cleanup work. PR #675, “Fix runner and MCP transport leaks,” bounded runner task-keyed bookkeeping and closed idle MCP owner/user transports that survived unclean disconnects. That was real.
The CPU climb after that was not. That distinction is the whole lesson: production agent infrastructure needs both code fixes and measurement discipline. If you mix them up, you either ignore a real leak or waste a morning tuning containers around a dashboard artifact.
The full reference guide, including role-by-role sizing and metric panel guidance, is in Performance & Resource Sizing.
Related field notes
A Frontier Model Is Rented. A Swarm Is Owned.
The durable IP of an AI-native company is not the model it calls. It is the learning loop it owns on top of models: memory, skills, workflows, traces, and evolved agents.
Script Workflows: Durable One-off Runs for Agent Work
A workflow's power for one ad-hoc job: launch a TypeScript run, journal every step, replay instead of restarting, and compose the reusable swarm scripts every agent gets by default.
The Architecture Behind Task Delegation: Pools, Routing, and Dependencies
How we built a task delegation system that routes work to the right AI agent automatically. Task pools, dependency graphs, offer/accept patterns, and the lessons from 3,000+ completed tasks.