26 tool calls, one script, $0.02: measuring “code mode”.
Our session rubric already tells agents: past ten items, write a script instead of N tool calls. We measured what that's worth on one production job, and where the savings stop.
Updated July 29, 2026 · The first version of this post drew deserved criticism on Hacker News. The prose was machine-drafted and read like it, and it said “we didn't estimate this” two paragraphs before a section full of estimates. This is a rewrite. The measurements are unchanged, the labels on them are now accurate, and we added the end-to-end production numbers the original left out.
In November, Anthropic published a piece on code execution with MCP: give an agent a sandbox and a generated API instead of raw tool calls, and a task that cost 150,000 tokens costs 2,000, because intermediate data never passes through the model's context. Cloudflare shipped the same idea in September as “Code Mode,” and later put a number on it: 2,500+ API endpoints, 1.17M tokens down to about 1,000.
None of that is a new idea. “If you do the same thing twice, write a script” predates LLMs by half a century. Agent Swarm sessions have shipped a version of it as a rubric for a while: past roughly ten items, or any bulk fan-out, the agent is told to write a script instead of making individual tool calls. It's the same machinery behind Script Workflows, and nothing in this post was built for the post.
What we hadn't done was measure it. So we picked one real job, ran the script path live, and modeled what the tool-call path would have put in front of the model. One number in this post is measured end to end, one is modeled from measured samples, and the difference is labeled everywhere it appears.
What the script does
workflow-triage scans every automation the swarm runs (all workflows and all cron schedules) and flags which ones are dead, failing, or fine. Under the hood that's 26 calls: one workflow_list, one schedule_list, and one workflow_listRuns per workflow (24 of them). An agent doing this with individual tool calls would make all 26, and every raw JSON payload would sit in its context for the rest of the conversation.
The script makes the same 26 calls inside a sandboxed subprocess. Only the final summary object reaches the agent.
The numbers
The script column comes off a live run. The raw-path column is modeled: we ran the same underlying calls on a sample and extrapolated to the full catalog (24 workflows, 60 schedules). The arithmetic is in the next section.
| Script (measured) | Raw tool calls (modeled) | |
|---|---|---|
| Calls made | 1 | 26 |
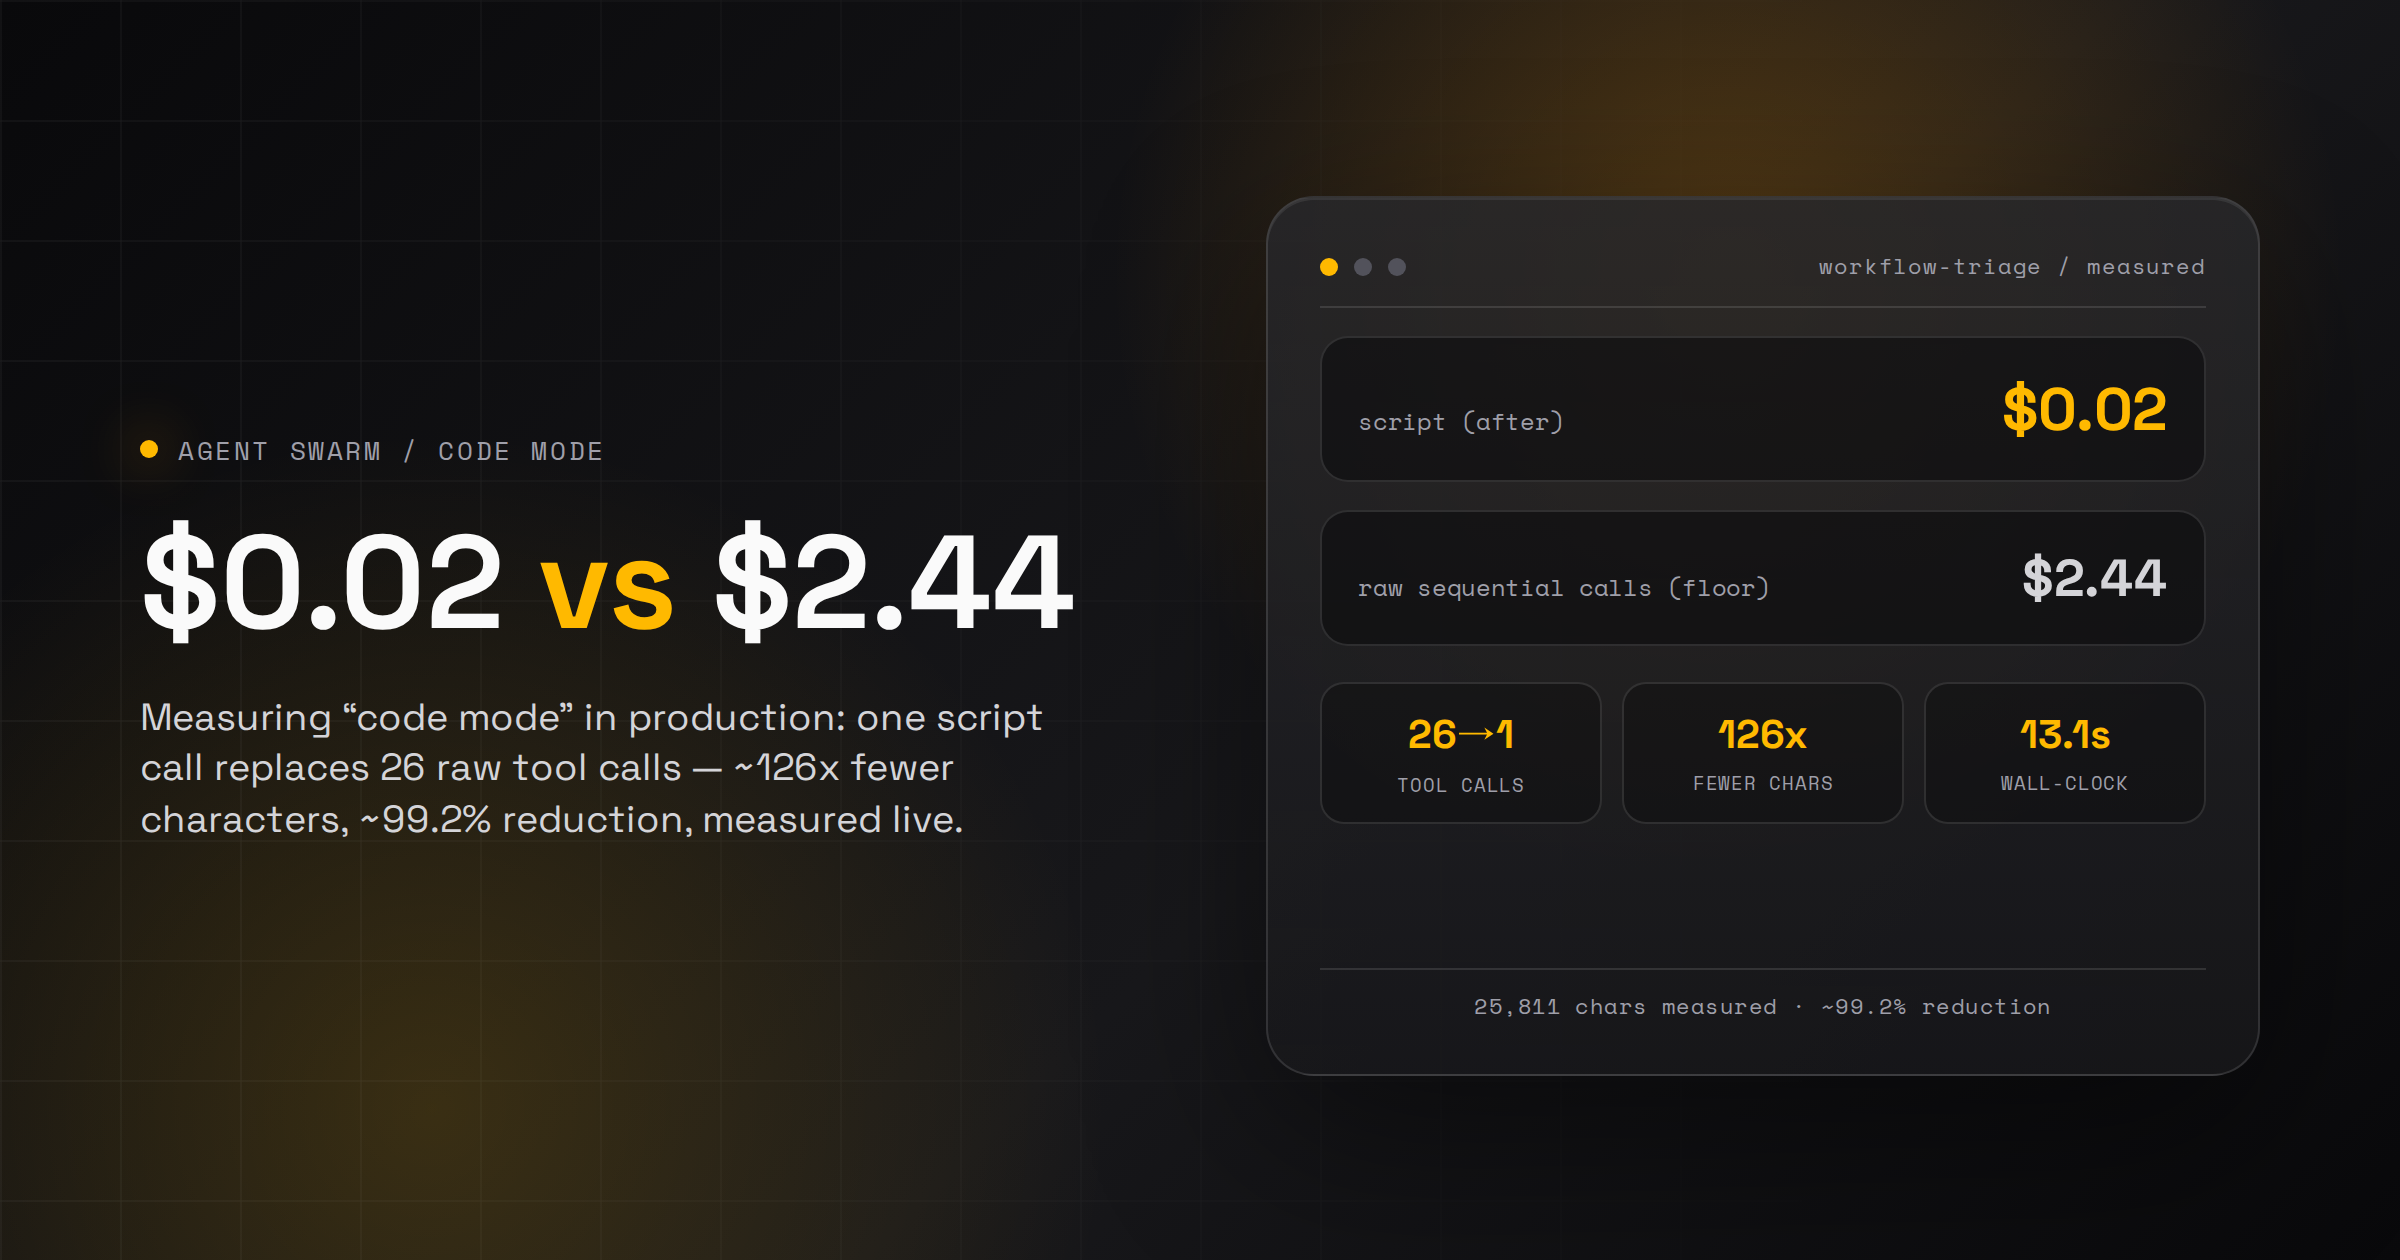
| Reaches the agent's context | 25,811 characters (one JSON result) | ~3.26M characters |
| Approx. tokens (chars ÷ 4) | ~6,450 | ~815,000 |
| Wall-clock | 13.12s (durationMs: 13120) | ~2–6.5 min (26 sequential turns) |
| Input cost (Claude Sonnet 5, $3/M tokens) | ~$0.02 | ~$2.44, as a lower bound |
| Reduction | – | ~126x fewer characters entering context (~99.2%) |
To be clear about what that last row claims: 99.2% is the reduction in bytes put in front of the model for this one data-gathering step, script versus tool calls. It is not the change in our bill. The end-to-end effect on the real scheduled task is further down, and it's smaller.
What's measured, what's modeled
- Measured: the script's side.
durationMs: 13120and the 25,811-character result came off a liveworkflow-triagerun. - Modeled from samples: the raw-path character count. We called the same underlying SDK methods directly, outside the script:
workflow_list({})returned 16,304 characters andschedule_list({})returned 72,105. Forworkflow_listRunswe sampled 4 of the 24 workflows, from smallest to largest: 6, 26, 53, and 227 runs, totalling 1,075,430 characters over 312 runs, an average of 3,447 characters per run. The script itself recorded 920 total runs across all 24 workflows, so 920 × 3,447 plus the two list calls gives ~3.26M characters. - Why we sampled instead of running all 26 calls: running the full raw path means pulling ~3.2M characters of JSON into a live context. We sampled a third of the runs (including the largest workflow) and extrapolated. If you think that weakens the number, that's fair. It's why every appearance of it is labeled modeled.
- A bug we found on the way: the
limit: 25we pass toworkflow_listRunsdoesn't cap the result: it returned all 227 runs for our busiest workflow. That's a real gap in the underlying API and it's getting a ticket. For this post's math it only means the raw-path number is understated, not overstated. - The $2.44 is a lower bound: it prices the tokens once, as if they entered context on a single turn. In a real agentic loop, each of the 26 tool results is re-sent as input on every later turn, the same mechanic behind Anthropic's 150K-token example. A real 26-turn run would cost a multiple of $2.44. We didn't run one, so we won't claim a multiplier.
What it changes end to end
The honest headline is not 99.2%. The schedule that runs this triage daily is the end-to-end picture: after the data-gathering moved into the script, run time went from around 5 minutes to 1–2 minutes, and per-run cost dropped by roughly half.
Why half and not 99%? Because the script only compresses the mechanical middle of the task. The agent still reads the summary, reasons about which flagged workflow actually matters, and decides what to escalate. In practice the run ends with a Slack ping telling us what to go check. That reasoning is most of what's left of the cost, and it's the part we want a model doing. Scripts don't remove the thinking at either end of a task; they stop the model from paying to page through raw JSON in between.
Since this measurement we've leaned in hard. As of late July the swarm runs about 150 reusable scripts, with ~25,000 script executions over the last 30 days, and roughly 70% of our schedules now use at least one. A 50% reduction on jobs that run every day, thousands of times a month, is the number we actually bank.
The code that does it
This is the whole script (id da3b5c7b-b9a6-4f9e-be9e-f682aca48ea0, global scope, callable by any agent in the swarm). Two of our agents wrote it.
// workflow-triage — read-only health scan of all workflows + schedules.
// Returns per-item run stats + DEAD/FAILING/OK flags + a markdown report of flagged items.
export default async function (args: any, ctx: any) {
  const runLimit = args?.runLimit ?? 25;
  const staleDays = args?.staleDays ?? 14;
  const includeSchedules = args?.includeSchedules ?? true;
  const now = Date.now();
  const dayMs = 86400000;
  const isFail = (s: string) => /fail|error|halt|timeout|abort/i.test(String(s || ""));

  // ---- Workflows: run stats require workflow_listRuns (no lastRunAt on the row) ----
  const wl = await ctx.swarm.workflow_list({});
  const wfs: any[] = wl?.data ?? [];
  const rows: any[] = [];
  const pool = 6; // small concurrency to avoid hammering
  for (let i = 0; i < wfs.length; i += pool) {
    const batch = wfs.slice(i, i + pool);
    const res = await Promise.all(batch.map(async (w: any) => {
      let runs: any[] = [];
      try { const rr = await ctx.swarm.workflow_listRuns({ workflowId: w.id, limit: runLimit }); runs = rr?.data ?? []; }
      catch { runs = []; }
      const total = runs.length;
      const failed = runs.filter((r: any) => isFail(r.status)).length;
      const stamps = runs.map((r: any) => Date.parse(r.startedAt || r.createdAt || r.finishedAt || "")).filter((n: number) => !isNaN(n));
      const lastRun = stamps.length ? Math.max(...stamps) : null;
      const daysSince = lastRun ? Math.round((now - lastRun) / dayMs * 10) / 10 : null;
      const failRatio = total ? Math.round(failed / total * 100) / 100 : 0;
      const dead = !w.enabled || total === 0 || (lastRun != null && daysSince! > staleDays);
      const failing = total >= 2 && failRatio >= 0.5;
      return {
        kind: "workflow", id: w.id, name: w.name, enabled: w.enabled,
        runs: total, failed, failRatio,
        lastRunAt: lastRun ? new Date(lastRun).toISOString() : null,
        daysSinceLastRun: daysSince, nodeCount: w.nodeCount,
        flag: failing ? "FAILING" : dead ? "DEAD" : "OK",
      };
    }));
    rows.push(...res);
  }

  // ---- Schedules: lastRunAt + consecutiveErrors already on the row ----
  const scRows: any[] = [];
  if (includeSchedules) {
    const sl = await ctx.swarm.schedule_list({});
    const scs: any[] = sl?.data?.schedules ?? [];
    for (const s of scs) {
      const lastRun = s.lastRunAt ? Date.parse(s.lastRunAt) : null;
      const daysSince = lastRun ? Math.round((now - lastRun) / dayMs * 10) / 10 : null;
      const dead = !s.enabled || (!lastRun) || (daysSince != null && daysSince > staleDays);
      const failing = (s.consecutiveErrors ?? 0) >= 3;
      scRows.push({
        kind: "schedule", id: s.id, name: s.name, enabled: s.enabled,
        consecutiveErrors: s.consecutiveErrors ?? 0,
        lastRunAt: s.lastRunAt ?? null, daysSinceLastRun: daysSince,
        nextRunAt: s.nextRunAt ?? null, cron: s.cronExpression,
        flag: failing ? "FAILING" : dead ? "DEAD" : "OK",
      });
    }
  }

  const rank = (f: string) => f === "FAILING" ? 0 : f === "DEAD" ? 1 : 2;
  rows.sort((a, b) => rank(a.flag) - rank(b.flag) || (b.failRatio - a.failRatio));
  scRows.sort((a, b) => rank(a.flag) - rank(b.flag) || (b.consecutiveErrors - a.consecutiveErrors));

  const sum = (arr: any[]) => ({
    total: arr.length,
    failing: arr.filter(r => r.flag === "FAILING").length,
    dead: arr.filter(r => r.flag === "DEAD").length,
    ok: arr.filter(r => r.flag === "OK").length,
  });

  // markdown report of only the flagged (non-OK) items
  const flaggedW = rows.filter(r => r.flag !== "OK");
  const flaggedS = scRows.filter(r => r.flag !== "OK");
  let report = `## Workflow triage — flagged\n`;
  report += `Workflows: ${sum(rows).failing} failing / ${sum(rows).dead} dead / ${sum(rows).ok} ok (of ${rows.length})\n`;
  // ... table-building omitted here for length; full source has per-row markdown
  //     tables for both workflows and schedules — see the script catalog entry.

  return {
    params: { runLimit, staleDays, includeSchedules },
    workflows: { summary: sum(rows), rows },
    schedules: includeSchedules ? { summary: sum(scRows), rows: scRows } : null,
    report,
  };
}
There's no framework here. It's a for loop with a concurrency pool of 6, some Date.parse, and a sort. The only thing that makes it “code mode” rather than 26 tool calls is where it runs. Every workflow_listRuns payload lands in the loop variable runs and stays there; the agent sees only the return at the bottom.
“Intermediate results stay in the execution environment by default... the agent only sees what you explicitly log or return.” Anthropic, Code execution with MCP
workflow-triage, one script call vs. 26 raw tool calls
The script puts ~0.79% of the raw path's tokens in front of the model
Each bar is a share of the modeled raw-tool-call path (~815,000 tokens, extrapolated from measured samples; arithmetic in the methodology section above). The ratio holds at any model's $/token rate.
The trade-offs
Two objections from the HN thread are worth answering rather than waving off.
You lose per-call approvals. One script that hits ten tools is coarser to gate than ten separate calls a human can approve one by one. True. Our answer is moving the boundary from calls to capabilities: scripts run in a sandbox with no filesystem access by default, and we're building role-based permissions so a script's ctx only exposes the tools that agent's role is allowed to touch. Gating the surface instead of the call is a different security model, not a free upgrade.
An ad-hoc script is unverified code. A one-off script the model YOLOs into a REPL has to be trusted fresh every time, which is a bad deal for anything that mutates state. That's why the unit we care about is the saved script: written once, reviewed once, visible in a dashboard, and re-run many times. The economics of “review it once” only work when the script is durable. That is the actual difference between this and telling your agent to feel free to write scripts.
Takeaway
The script-over-tool-calls rubric already ships in every claude/codex/opencode session template, so for us the question was never whether to adopt code mode. The measurement made the rubric sharper: 26 calls became one, 13 seconds, about two cents to read the result, and roughly half the cost of the real daily job that uses it. If you're building something similar, the implementation matters less than the properties: give the agent a way to write its own software, and make sure what it writes is type safe, sandboxed, and reusable.
/ references
Sources and further reading
Related field notes
TasteLabs Found Design Drift in Our Own Sites
Our landing sites had three amber ramps, 34 untokenized brand-color literals, and no BRAND.md files. One fix PR has merged; one is still open.
25 FOSS repos agent-swarm stargazers love, and will become key for your agentic infra.
We looked into 528,916 star edges, 228,177 distinct repositories, from 655 agent-swarm GitHub stargazers.
59% of Our Agent Failures Lasted Under 10 Seconds. We Debugged Them Like Logic Bugs.
Binary success/failure metrics are killing your debugging velocity. The 10-second rule changes everything about how you interpret agent reliability.