Cover 80% of Debugging: Agent Dashboard Design for Engineers
Implementation-first guide for engineers to build operable agent dashboards: span tracing, checkpoint replays, review queues, and live cost tracking for...
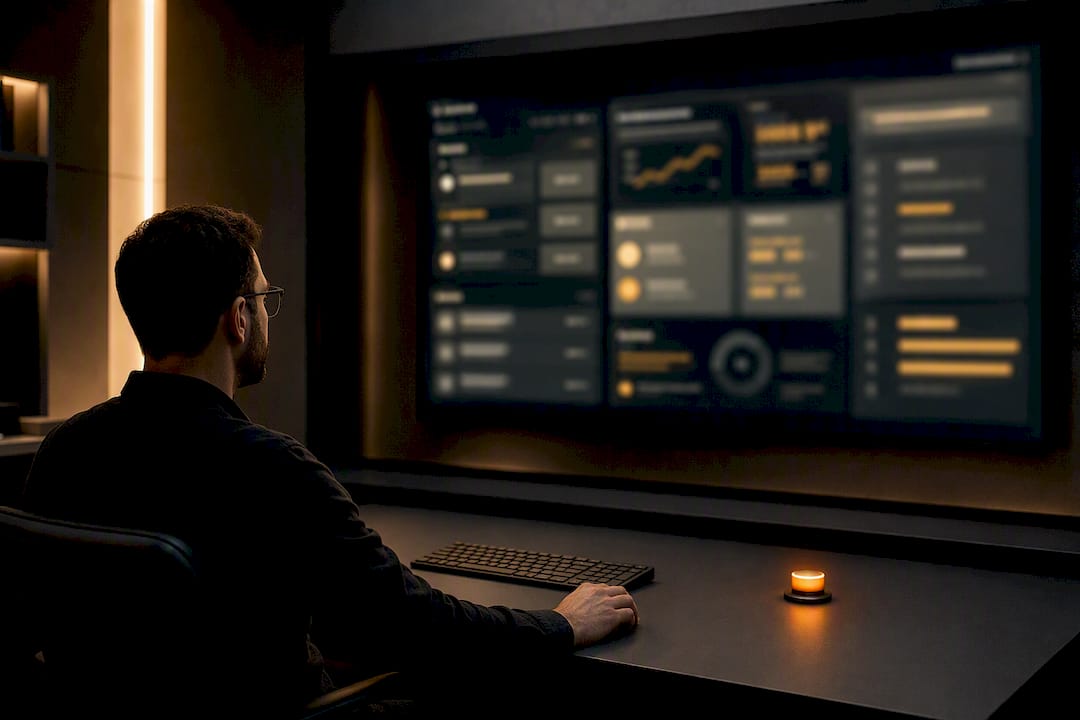
A working agent swarm dashboard must answer three questions instantly: who did what, why, and whether the outcome can be reproduced. That means surfacing per-agent state and heartbeats, a run trace with causal links between agents, a review queue for anything risky, and live cost per agent. Every design decision after that should serve traceability and replay, not chart aesthetics.
TL;DR:
- Most teams should sample full traces during incidents and switch to lower rates during stable operation to balance detail and cost.
- Checkpointing at key stages and recording tool outputs are essential for effective debugging and replay of multi-agent failures.
- Hierarchical span-based telemetry with detailed payloads enables precise cost, performance, and error analysis at the agent and tool-call level.
- Governance and review systems must be integrated at the control plane, with trust tiers, audit trails, and automated escalation for safety and compliance.
- Building a minimal dashboard with overview, agent status, and review queue first allows early deployment and incremental addition of advanced features.
Table of Contents
- What Metrics and Information Architecture Does an Agent Dashboard Design Need?
- How Should You Structure the Agent Dashboard UI?
- How Do You Debug and Replay Agent Runs?
- What Tracing and Telemetry Standards Should You Use?
- How Do You Design Governance and Human Review Into the Dashboard?
- How Do You Roll Out an Agent Dashboard in Production?
- Ez.'s Perspective: What Operators Actually Use
- How agent-swarm Puts This Design Into Practice
- Where to Go Deeper on Agent Dashboard Design
- Sources
- FAQ
What Metrics and Information Architecture Does an Agent Dashboard Design Need?
Every agent dashboard design starts with a data model, not a layout. Get the schema wrong and no amount of UI polish fixes it later.
At the agent level, you need status (idle, running, blocked, failed), last heartbeat timestamp, token and dollar cost for the current run, and a rolling tool error rate. At the run level, you need a unique run ID, a causality chain showing which agent spawned which, checkpoint markers, and fork lineage when a run branches. Sentry's guidance on multi-agent systems is blunt about why this matters: grouping token usage and tool errors by agent, not by system, is what actually reveals which agent is burning budget or breaking down.
Retention is a real tradeoff, not an afterthought. Full traces for every run get expensive fast, so most teams sample production traffic and switch to 100% capture only during incident response or for a fixed window after a new agent ships.
Your dashboard header should carry only what an operator needs in the first two seconds:
- Active agents and their current status breakdown
- Runs in progress vs. queued vs. failed in the last hour
- Total spend against budget for the current period
- Open review-queue items waiting on a human
How Should You Structure the Agent Dashboard UI?
The information architecture flows from an overview down to a single message, and each layer should feel like zooming in rather than navigating away.
The overview hero sits at the top: swarm-wide health, active run count, and budget burn, refreshed continuously rather than on manual reload. Below it, the agent grid shows one card per agent with name, role, current status, last action, and a live cost ticker. Card design matters more than teams expect. A card that just says "Agent 3: Running" is useless. A card showing "Researcher: fetching pricing page (12s)" tells an operator whether to wait or intervene.
Clicking a card opens the agent detail panel: a live feed of the agent's actions, expandable tool calls with full inputs and outputs, and quick actions like pause, kill, or escalate to human review. This is where debugging actually happens, so latency here matters as much as latency in the agents themselves.
For comparing runs, a timeline or commit-graph view works better than a flat log. Branching visualizations that annotate forks and resets let operators compare alternate conversation paths side by side instead of scrolling through two separate transcripts trying to spot where they diverged.
Pro Tip: Collapse tool call arguments by default and expand on click. A grid of ten agent cards with fully expanded JSON payloads is unreadable no matter how good your CSS is.
Progressive disclosure isn't optional once you pass a dozen concurrent agents. Group by workflow or team, let operators filter by status or trust tier, and reserve full detail views for the one agent they clicked into.
How Do You Debug and Replay Agent Runs?
Debugging a multi-agent failure after the fact requires the same state the agents had when it happened, which means checkpointing is a design requirement, not a nice-to-have.
Checkpoint agent state at every meaningful transition (message sent, tool call completed, handoff to another agent) and capture the exact tool outputs alongside it. Without recorded outputs, replay just re-runs the tool with different results and you learn nothing.
- Reset to a checkpoint. Let operators jump back to any prior message in a run without restarting the whole session.
- Edit and fork. Allow inline edits to a message at that checkpoint, then branch a new run from it, keeping the original intact for comparison.
- Replay and diverge. Re-run the forked branch and diff its outputs against the original to isolate exactly where behavior changed.
- Promote to regression test. Once a failure is understood, save the checkpoint and expected output as a fixture so the fix can be verified automatically on every future deploy.
Research on interactive multi-agent debugging backs this pattern directly:
Checkpointing agent state and allowing resets to earlier messages, combined with inline edits, gives operators a concrete way to steer and debug agent teams rather than just observing them fail.
That finding comes out of the CHI 2025 study on interactive debugging for multi-agent AI, and it lines up with practitioner advice to treat agents like a distributed system: wrap every LLM and tool call in a recordable span, then replay production runs deterministically with stubbed dependencies. A replay harness built this way turns every production incident into a regression test instead of a story someone tells in standup.
What Tracing and Telemetry Standards Should You Use?
Structured tracing is the backbone that makes everything above actually work. Without span-level telemetry, your dashboard is just displaying opinions about what happened.
Use hierarchical spans built on the gen_ai.invoke_agent convention, with each tool call nested as a child span under its parent agent invocation. Tag every span with the run ID and agent ID so you can pivot from a cost spike straight down to the exact tool call that caused it.
Each span should carry:
- Full input and output payloads (or references to stored artifacts, if payloads are large)
- Model name and parameters (temperature, max tokens, model version)
- Token counts, split between input and output
- Duration, so you can compute p95 and p99 latency per agent, not just system-wide
Sampling is where most teams get it wrong in one direction or the other. Sentry's multi-agent observability guidance recommends capturing prompts and responses at every agent boundary, sampling at 100% when you're actively debugging a known issue, and easing back to a lower sampling rate once the system is stable. Weights & Biases frames this as one of four observability pillars: monitoring, tracing, evaluation, and governance, and argues tracing only pays off when it's tied back into evaluation, not left as a pile of unread logs.
How Do You Design Governance and Human Review Into the Dashboard?
Governance can't live in a policy document if the dashboard doesn't enforce it. A control plane needs trust tiers and an audit trail as first-class UI elements, not an afterthought bolted on after launch.
A three-tier trust model covers most cases: auto-approve for low-risk actions, review-required for anything touching production data or spend, and deny for actions the agent should never take unsupervised. Set this per agent, not globally, since a research agent and a deployment agent carry very different risk profiles.
The review queue itself needs three actions available on every item: accept as-is, edit and accept, or reject with a reason. Each decision should write to an audit log that captures the agent, the action, the reviewer, the timestamp, and the outcome, retained long enough to support a postmortem months later.
- Set per-agent budget thresholds that trigger auto-halt, not just alerts
- Detect repetitive tool calls (loop behavior) and pause automatically
- Escalate to a human when an agent hits a denied action or budget ceiling
The governance-first approach to agent access control treats these controls as part of the control plane itself, which matches what the open-source Mission Control project demonstrates: governance, trust tiers, and approvals belong in the same layer as task dispatch and agent registration, not as a separate compliance tool nobody opens.
How Do You Roll Out an Agent Dashboard in Production?
Build in this order, and resist the urge to build the polished version of everything before any of it ships:
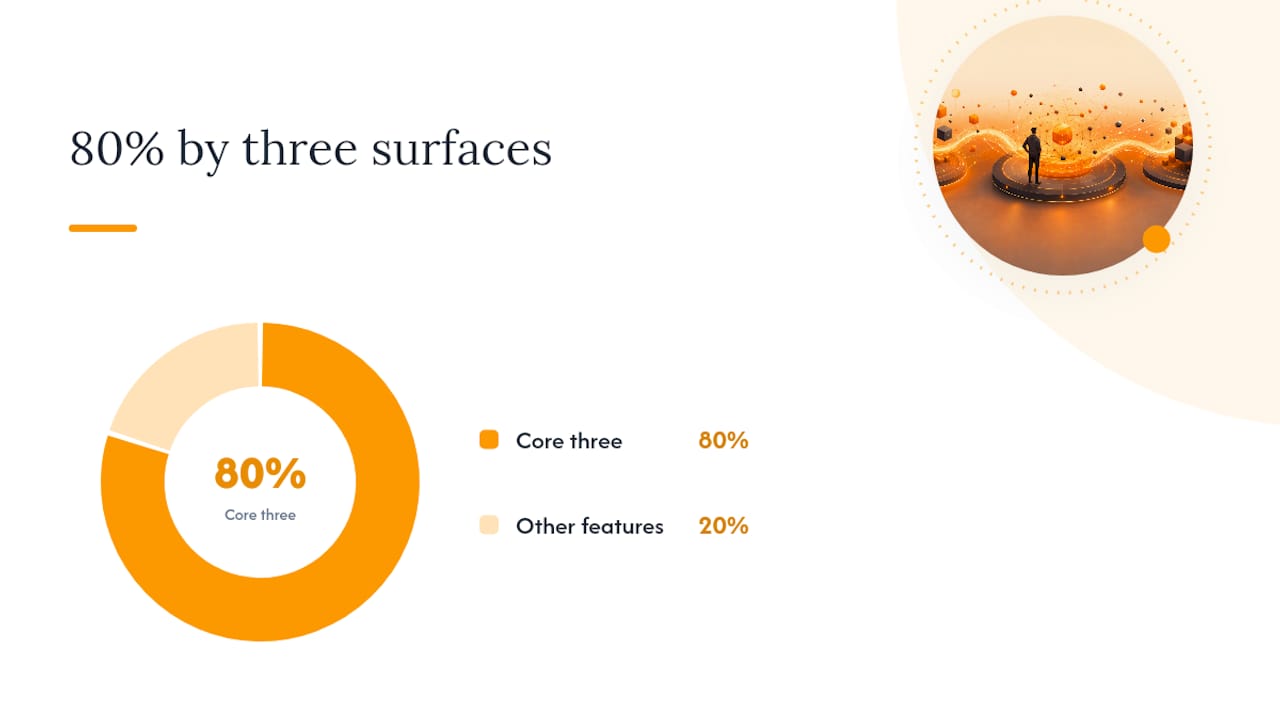
- Ship the overview hero, agent grid, and detail panel first. These three surfaces cover 80% of daily debugging needs before you build anything else.
- Add the review queue next. Any swarm doing real work needs a human checkpoint before it needs a fancier chart.
- Instrument spans and store traces. Wrap every LLM and tool call, tag with run and agent IDs, and pick your sampling rule before volume forces the decision on you.
- Build the replay harness. Even a rough version that re-runs a checkpoint with stubbed tools beats no replay at all.
- Layer on alerts, cost dashboards, and RBAC. These harden the system for scale, not for launch day.
- Write runbooks and onboarding docs so a new operator can debug a stuck run without pinging the person who built it.
For testing, treat every resolved incident as a candidate regression test. Run these nightly against your replay harness and gate deploys on them passing.
Pro Tip: Don't wait for a "big" incident to build your first regression test. Convert the first minor checkpoint failure you see. It forces you to validate the replay harness works before you actually need it.
Ez.'s Perspective: What Operators Actually Use
The agent grid and review queue get opened constantly. The commit-graph fork view gets ignored until the week someone actually needs it, then it's the only thing that matters. Vague agent names and low sampling rates are the two mistakes that quietly cost the most debugging time. Check the example sessions for what causal traces look like in practice.
— Ez.-
How agent-swarm Puts This Design Into Practice
An agent swarm is built around a model where a lead agent breaks work into tasks, assigns them to isolated worker containers running AI agents, and maintains shared memory compounding across runs instead of resetting every session. That's a meaningfully different starting point than a workspace you configure by hand or a single AI employee handling everything sequentially.
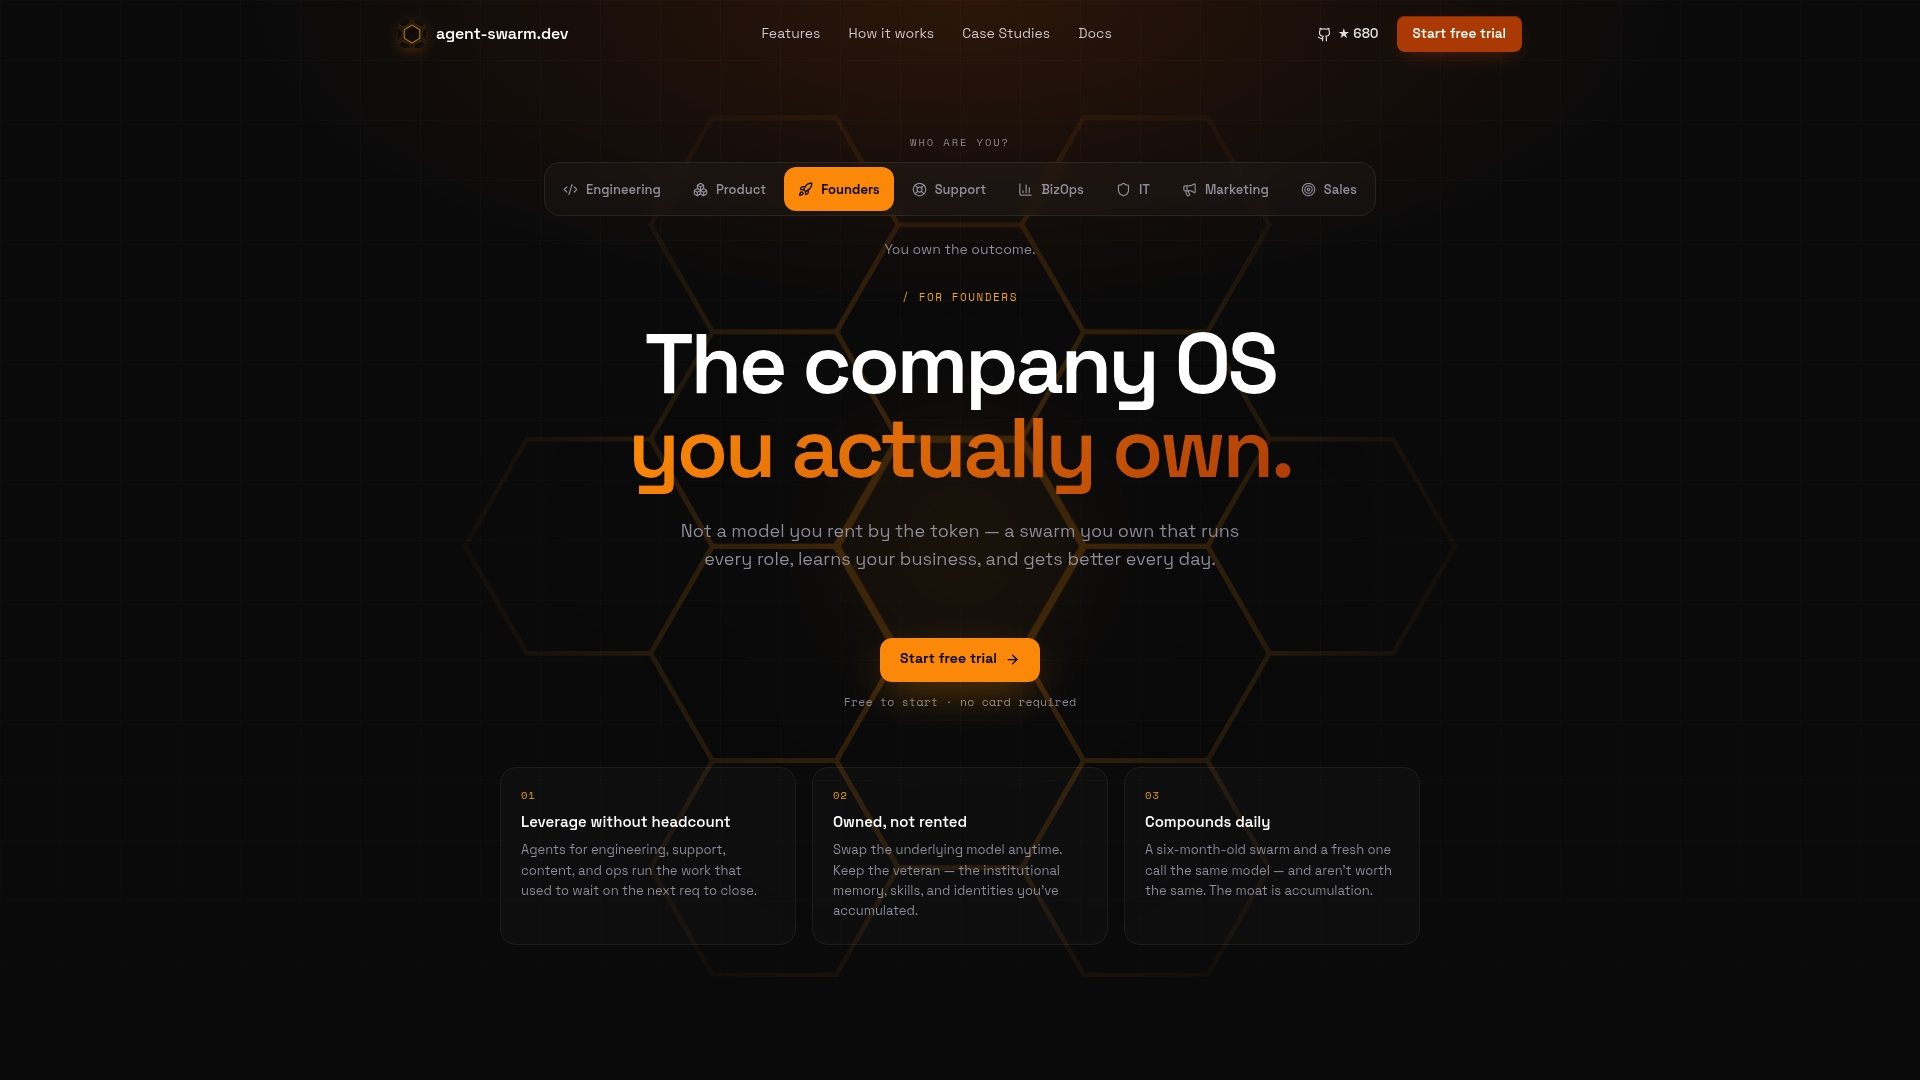
The control plane, session tracing, and checkpointing patterns covered above map directly onto how agent-swarm tracks runs, costs, and handoffs across integrations like Slack, Linear, and GitHub, making AI without cloud a practical option for SMBs. If you're evaluating how a real deployment behaves under production load, the Capchase case study walks through outcomes from an actual rollout, and the example sessions show run traces, forks, and replays in the actual interface rather than a mockup. Both self-hosted (MIT license, free) and cloud-hosted options are available depending on whether your team wants to run the control plane itself or hand that off. Start with the examples, then request a walkthrough of your own workflow against a live swarm.
Where to Go Deeper on Agent Dashboard Design
The CHI 2025 paper on interactive debugging for multi-agent systems is the strongest source on debugging UX specifically, covering checkpoint-and-reset interactions in detail. Sentry's guide to multi-agent observability covers span-level tracing patterns and boundary instrumentation. Weights & Biases' agent observability guide lays out the four evaluation pillars. The Mission Control repository is the clearest open reference for control-plane architecture.
Sources
- Interactive Debugging and Steering of Multi-Agent AI Systems (CHI 2025)
- Debugging multi-agent AI: When the failure is in the space between agents | Sentry Blog
- Mastering AI agent observability: From black-box to traceable systems - Weights & Biases
- mission-control (GitHub) — self-hosted control plane
FAQ
What Is an Agent Dashboard Design Used For?
It's used to monitor, debug, and control multi-agent AI swarms in production, giving operators visibility into agent state, run traces, costs, and pending human reviews in one interface.
What Metrics Should an Agent Control Panel Track First?
Start with per-agent status and heartbeat, token and dollar cost per run, tool error rate, and open review-queue items, since these cover most day-to-day debugging needs.
Why Is Replay Important in Dashboard Design for Agents?
Replay lets operators reproduce a past failure using recorded checkpoints and tool outputs, turning a one-off incident into a regression test instead of a mystery.
How Does OpenTelemetry Fit Into Agent Performance Tracking Design?
OpenTelemetry's gen_ai.invoke_agent convention provides the hierarchical span structure needed to trace agent and tool calls across boundaries, which underlies most multi-agent observability tooling today.
Does agent-swarm Include Built-In Dashboard Features?
Yes. agent-swarm's control plane includes session tracing, checkpointing, and integrations with tools like Slack and GitHub, matching the architecture patterns described throughout this guide.
Recommended
Related field notes
Para ingenieros: controla el gasto de IA con reserva atómica
Guía práctica para ingenieros: patrones técnicos (reserva atómica, interruptor antes del proveedor), métricas y lista de verificación de despliegue para...
Product managers: Orchestrate Product Management Automation in a 6‑Week Pilot
A practical playbook for product managers to pilot product management automation. Start with three safe automations and run a 6‑week pilot that treats PMs...
Memory vs Context Window: 4 Steps to Measure MECW, Build Tiered Memory
Practical playbook for engineers: measure your model’s MECW, avoid quadratic attention costs, and deploy a tiered retrieval memory system in four clear...